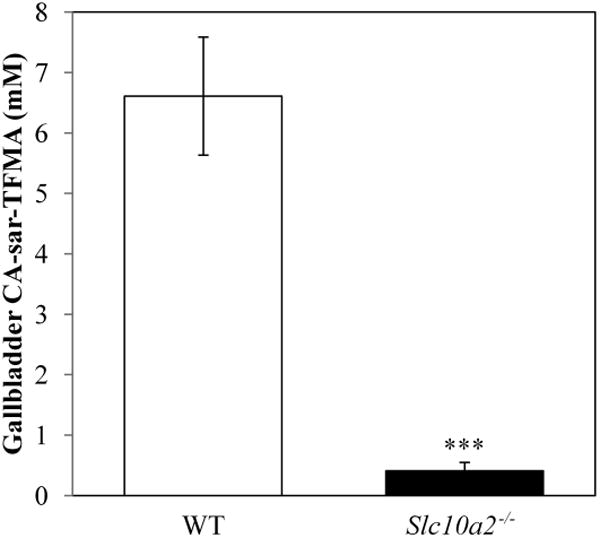
Figure 8.

Gallbladder concentration of CA-sar-TFMA in WT and knockout (Slc10A2−/−) mice (n = 4 each). Mice were gavaged with 150 mg/kg CA-sar-TFMA and euthanized 7 h later. LC/MS/MS analysis showed a significant difference in gallbladder concentration between the two groups (6.61 ± 0.98 mM in WT mice vs. 0.41 ± 0.14 mM in knockout mice, p = 0.0008).
