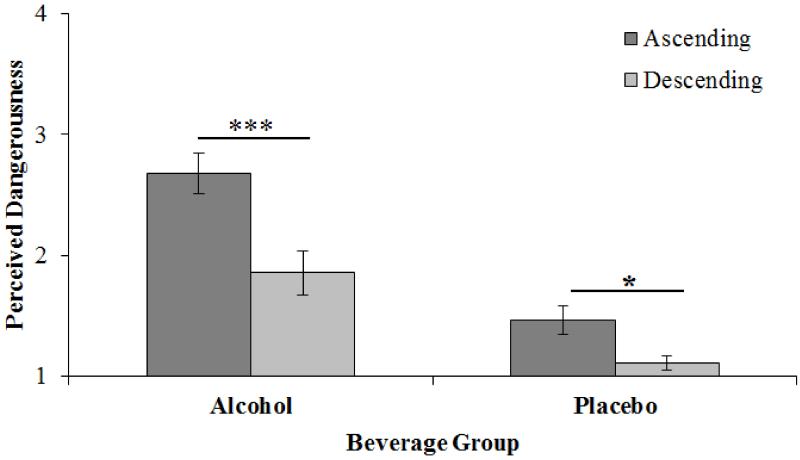
Fig. 1. Differences in Perceptions of Danger of Driving across Ascending and Descending Limbs.
Means for perceived danger of driving after drinking for alcohol and placebo beverage groups on the ascending (dark gray bars) and descending (light gray bars) limbs of the breath alcohol concentration curve. Larger values on the vertical axis are associated with greater perceived danger of driving after drinking (1 = “not at all dangerous” 2 = “a little dangerous” 3 = “somewhat dangerous” 4 = “extremely dangerous”). Error bars reflect standard error of the mean. Note: **p < .01; ***p < .001.

