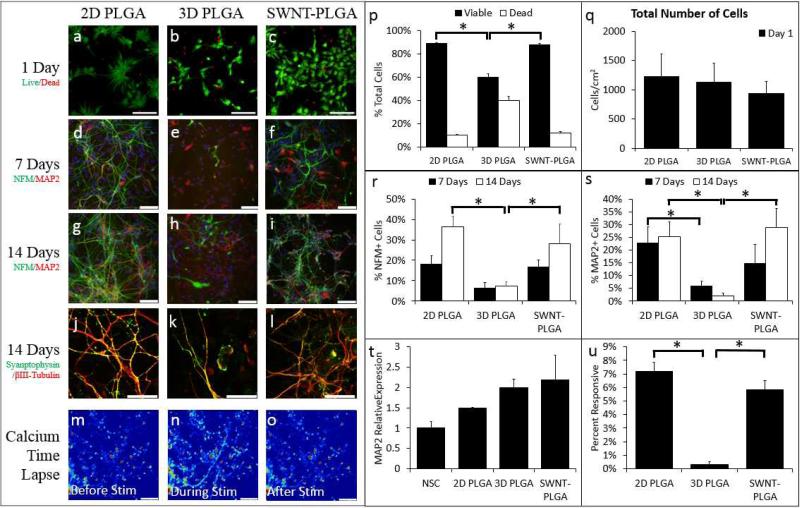
Figure 2. SWNT-PGLA substrates elicit enhanced neuronal differentiation of hNSCs.
hNSCs were cultured on 2D PLGA, 3D PLGA and SWNT-PLGA to determine the effect of SWNT vacuum impregnation on hNSC differentiation and viability. The cells were labeled as live (green) or dead (red) after 1 day of substrate growth (a-c). The cells were significantly more viable in 2D PLGA (p<1e-6) and SWNT-PLGA (p<1e-6) versus 3D PLGA culture platforms (p-q). These cells were labeled for antibodies NFM (green) and MAP2 (red) at 7 and 14 days in situ (d-i) and for Synaptophysin (green) and βIII-tubulin (red) at 14 days in the substrate (j-l). Mature, punctate Synaptophysin can be seen in the neurites and cell bodies of the cells of both conditions at day 14. The percentage of cells positive for NFM (r) increased with time on SWNT-PLGA and showed greater enhancement (p<0.01) compared to 3D PLGA after 14 days of culture. Percentage of MAP2 (s) positive cells increased through14 days after plating on SWNT-PLGA, with greater enhancement (p<2e-4) compared to 3D PLGA. PCR was performed to assay the fold gene expression of MAP2(t). Time lapse of calcium imaging, taken after 14 days of culture, (m-o) shows calcium levels in cells before, during, and after brief electrical stimulation. There is a significant increase in percentage of cells responsive to electrical stimulation via calcium influx on SWNT-PLGA (p<1e-5) compared to 3D PLGA (u). All statistics were carried out via ANOVA with Bonferroni-Holm correction. Scale bars on Live/Dead images are 10μm (a-c); those on NFM/MAP2 and Synaptophysin images are 50μm (d-l); and those on Calcium Time Lapse images are 1μm (m-o). *Significantly Different from 3D PLGA

