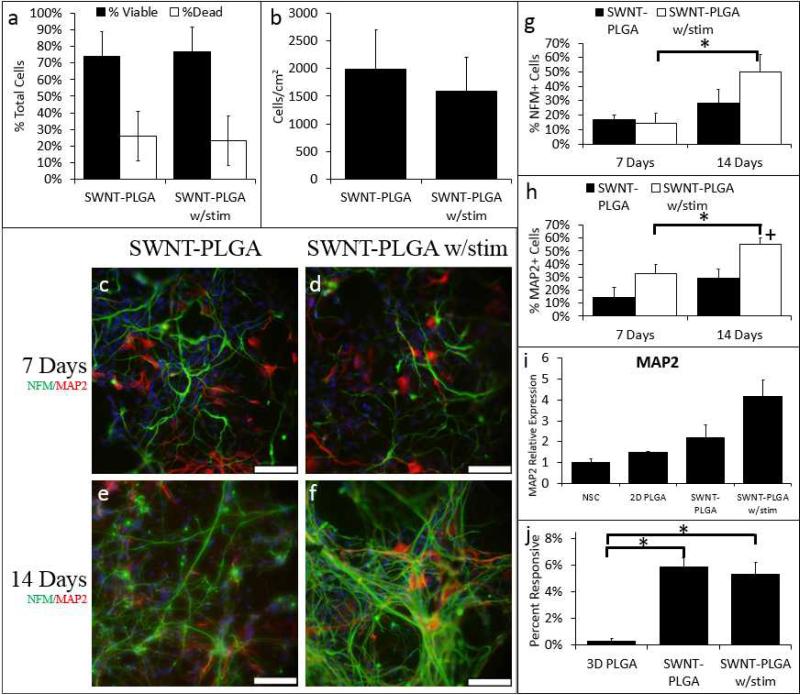
Figure 3. Electrical stimulation further enhances neuronal differentiation of hNSCs in SWNT PLGA substrates.
hNSCs were cultured on SWNT-PLGA, and at day 3, selected substrates were electrically stimulated for ten minutes at 30μA. On day 4, one day after stimulation, cell viability testing determined that there was no significant decrease in cell viability or number due to electrical stimulation (a & b). After 7 and 14 days, the cells were fixed and all conditions were labeled with antibodies for NFM (green) and MAP2 (red) (c-f). The percentage of NFM and MAP2 cells for each condition are shown (g & h). On day 7 there is a significant increase in the percentage of MAP2 positive cells on the electrically stimulated SWNT-PLGA substrates versus 2D PLGA (p<5e-4). On day 14, electrical stimulation significantly increased percentage MAP2 positive cells compared to 2D PLGA (p=0.008), 3D PLGA (p<1e-8), and SWNT-PLGA alone (p= 0.02). PCR analysis of MAP2 gene fold expression (i) showed responsiveness following electrical stimulation. The percentage of cells responsive to electrical stimulation via calcium influx was quantified (j); Cells on SWNT-PLGA with (p<1e-3) and without (p<2e-6) stimulation are significantly more responsive compared to 2D PLGA. A comparison study for PLGA substrates containing no SWNT but electrically stimulated can be found in the supplementary information. *Significantly Different from 3D PLGA +Significantly different from 3D PLGA and SWNT-PLGA (ANOVA with Bonferroni-Holm Correction). Scale bars on NFM/MAP2 images are 50μm (c-f);

