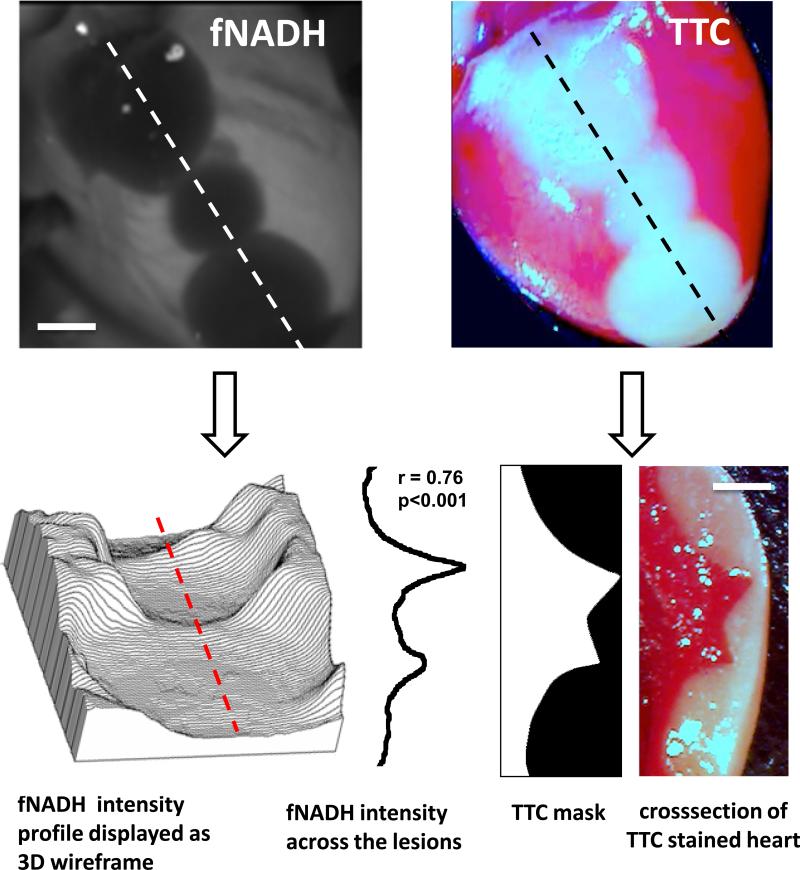
Figure 6.
Loss of epicardial fNADH correlates to cryolesion depth. fNADH and TTC images of the same heart with three cryolesions. Scale bar 2 mm. The topography graph on lower left represents the same fNADH image but as a 3D wire surface. The latter enables a better appreciation of ability of epicardial fNADH intensity to reveal lesion depth. Next to it is fNADH intensity profile measured along red dotted line. It closely correlates with the transmural TTC profile of the lesion.

