
Figure 2. −1.5 SD Scores for 8 Cognitive Tests from Linear Regression Models by Age at Time of Cognitive Testing and Education Category in Blacks and Whites.
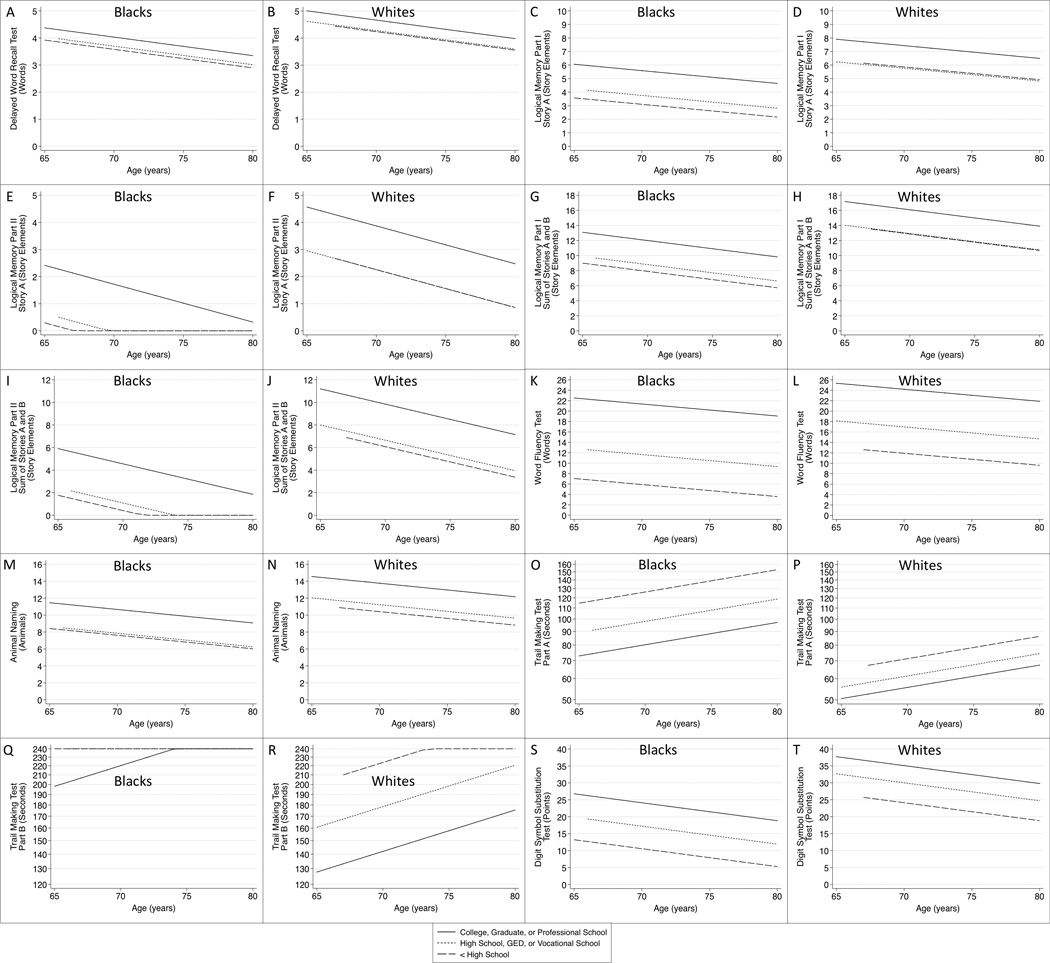
Panels A and B: Delayed Word Recall Test, Panels C and D: Logical Memory Part I Story A, Panels E and F: Logical Memory Part II Story A, Panels G and H: Logical Memory Part I Sum of Stories A and B, Panels I and J: Logical Memory Part II Sum of Stories A and B, Panels K and L: Word Fluency Test, Panels M and N: Animal Naming, Panels O and P: Trail Making Test Part A, Panels Q and R: Trail Making Test Part B, Panels S and T: Digit Symbol Substitution Test.
Footnote.
Higher score represents worse performance on Trail Making Test Parts A and B. Data for Trail Making Test Part B is from a subsample of participants who completed this test (n=651). The length of the lines reflects age distribution of each age and education category.