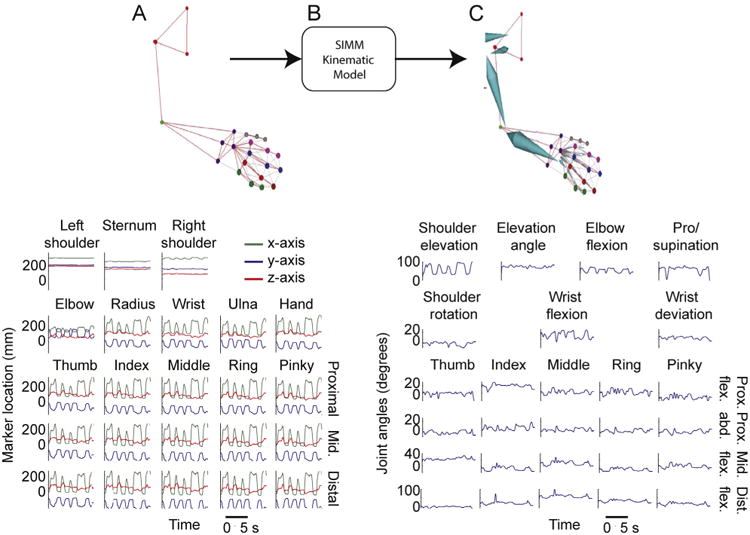
Fig. 2.

(A) An upper limb marker-set is identified in real-time, and each marker is denoted by a different color, note the linkages (gray lines) between pairs of markers. These links dictate the template logical constraints for spatial relationships between linked markers (top). The x-, y- and z-positions of all markers, measured in millimeters from a pre-calibrated origin (bottom). (B) Marker location data is input into the SIMM kinematic model. (C) The kinematic model outputs a 36-D, HTR segmental model that follows the movements of the upper limb markerset in real-time (top), and joint angles for the 27 upper limb joint movements are output.
