Abstract
Group-wise activation detection in task-based fMRI has been widely used because of its robustness to noises and its capacity to deal with variability of individual brains. However, current group-wise fMRI activation detection methods typically rely on the co-registration of individual brains’ fMRI images, which has difficulty in dealing with the remarkable anatomic variation of different brains. As a consequence, the resulted misalignments could significantly degrade the required inter-subject correspondences, thus substantially reducing the sensitivity and specificity of group-wise fMRI activation detection. To deal with these challenges, this paper presents a novel approach to detecting group-wise fMRI activation on our recently developed and validated Dense Individualized and Common Connectivity-based Cortical Landmarks (DICCCOL). The basic idea here is that the first-level general linear model (GLM) analysis is first performed on the fMRI signal of each corresponding DICCCOL landmark in individual brain’s own space, and then the estimated effect sizes of the same landmark from a group of subjects are statistically assessed with the mixed-effect model at the group level. Finally, the consistently activated DICCCOL landmarks are determined and declared in a group-wise fashion in response to external block-based stimuli. Our experimental results have demonstrated that the proposed approach can detect meaningful activations.
Keywords: DTI, fMRI, group-wise activation detection, DICCCOL
1. INTRODUCTION
Activation detection to task-based fMRI has been widely recognized as a benchmark approach to localizing functional brain regions that are involved in specific perceptual, cognitive or functional tasks (Friston et al., 1994; Heeger and Ress, 2002; Matthews and Jezzard, 2004; Logothetis et al., 2008). However, despite the dominant successes of analyzing individual brain’s activation patterns (e.g., Worsley and Friston, 1997; Bullmore et al., 1996; Woolrich et al., 2001a), it has been challenging to derive consistent fMRI activation patterns across different brains and populations, due to the individual variability and different sources of noises (e.g., Thirion et al., 2007; Derrfuss and Mar, 2009; Laird et al., 2009; Hamilton, 2009; Costafreda, 2009; Tahmasebi, 2010). To address this challenge, researchers in the neuroimaging field have developed group-wise activation detection methods, such as the two-level group-wise GLM method (Beckmann et al., 2003), Bayesian inference (Woolrich et al., 2004b), multi-level analysis (Thirion et al., 2007), group ICA analysis (Calhoun et al., 2009), and group Markov Random Field (MRF) methods (Ng et al., 2010), among others. The rationale behind these group-wise fMRI activation detection methods is to leverage the statistical power from multiple brains in order to gain the robustness to noises and the less sensitivity to individual variability. For instance, the FSL FEAT/FLAME toolkits (Beckmann et al., 2003; Smith et al., 2004) incorporated a two-level group-wise GLM analysis procedure that warps the individual activation significance maps to the same template space via image registration methods (e.g., FSL FLIRT), and then infers the group-wise significantly activated regions from the pooled activation maps. The major advantages of this two-level GLM method include the facilitation of valid group analyses and inference, good flexibility and generality, and easy and meaningful interpretation of results (Beckmann et al., 2003; Smith et al., 2004).
Though these group-wise fMRI activation detection methods possess various advantages and have been successfully applied in different scenarios, there are still at least three challenges that warrant further research. First, existing group-wise activation detection methods still heavily rely on image registration algorithms that warp an individual brain’s MRI/fMRI images and activation maps into the template space. It has been widely recognized that image registration algorithms have difficulty in dealing with the anatomic variation of different brains (e.g., Ardekani et al., 2004; Thirion et al., 2006; Stiers et al., 2006; Jan et al., 2009; Tahmasebi, 2010; Li et al., 2010c; Zhu et al., 2012). Consequently, the misalignments between different activation maps from individual brains could substantially decrease the sensitivity and specificity of those group-wise fMRI activation detection methods (e.g., Thirion et al., 2006; Stiers et al., 2006; Thirion et al., 2007). As a remedy, current group-wise fMRI activation detection methods rely on spatial smoothing to account for the misalignments across different brain images (Friston et al., 1996; Mikl et al., 2008; Tahmasebi et al., 2009; Tahmasebi, 2010; Yue et al., 2010; Li et al., 2012e), which potentially decreases the sensitivity and specificity of the detection of truly activated brain regions (Mikl et al., 2008; Yue et al., 2010). Second, there is considerable variability of activation magnitudes for the corresponding brain regions across individual subjects and imaging sessions (Smith et al., 2005; Thirion et al., 2007), due to physiological noises, head/body motion, resting-state activity and other factors. This variability imposes additional challenges to the robust and reliable inference of group-wise consistent activation foci. Third, there is considerable individual variability of brain networks evoked by a specific fMRI task (Thirion et al., 2007), and thus meta-analysis has been commonly used as a remedy to enhance the statistical power and reliability of individual fMRI studies (Derrfuss and Mar, 2009; Laird et al., 2009). To deal with the abovementioned three challenges, continuous efforts have been devoted to developing new group-wise fMRI analysis methods including: methods based on registration (Beckmann et al., 2003; Li et al. 2011, Li et al. 2013); methods adaptive to moderate variability (Ng et al., 2012; Kim et al., 2010, Xu et al., 2010; Kang et al., 2012). Advantages of these contributions are valuable in building up correspondence across subjects for group analysis.
This paper presents a novel, alternative group-wise fMRI activation detection approach that employs a recently discovered and validated dense map of individualized and common cortical landmarks, named DICCCOL (Dense Individualized and Common Connectivity-based Cortical Landmarks) (Zhu et al., 2012; Li et al., 2012a). Briefly, these 358 DICCCOLs possess intrinsic structural correspondences across individuals and populations, and these landmarks were located and optimized from an initialization of 2056 cortical landmarks regularly placed on the cortical surfaces of ten template subjects (Zhu et al., 2012). The optimization procedure aimed to maximize the group-wise consistency of DTI-derived white matter fiber connection patterns represented by the trace-map models (Zhu et al., 2011; Zhu et al., 2012), and it turned out that these optimized connectivity-based cortical landmarks exhibit both structural and functional correspondences across subjects and populations (Zhu et al., 2012). The neuroscience foundation is that each cortical region’s cytoarchitectonic area has a unique set of extrinsic inputs/outputs (named the “connectional fingerprint” (Passingham et al., 2002)), which largely determines the functions that each cortical area could possibly possess. This close relationship between structural connectivity pattern and brain function has been reported and replicated in a series of recent works (Li et al., 2010a; Zhu et al., 2011; Zhu et al., 2012; Zhang et al., 2011b; Li et al., 2012a; Li et al., 2012b; Li et al., 2012c). Extensive validation studies using multimodal DTI/fMRI datasets of over 240 brains have demonstrated the reproducibility and predictability of these 358 DICCCOL landmarks (Zhu et al., 2012). These 358 DICCCOL models and the source codes for their prediction in individual brains based on DTI data have been released online at: http://dicccol.cs.uga.edu.
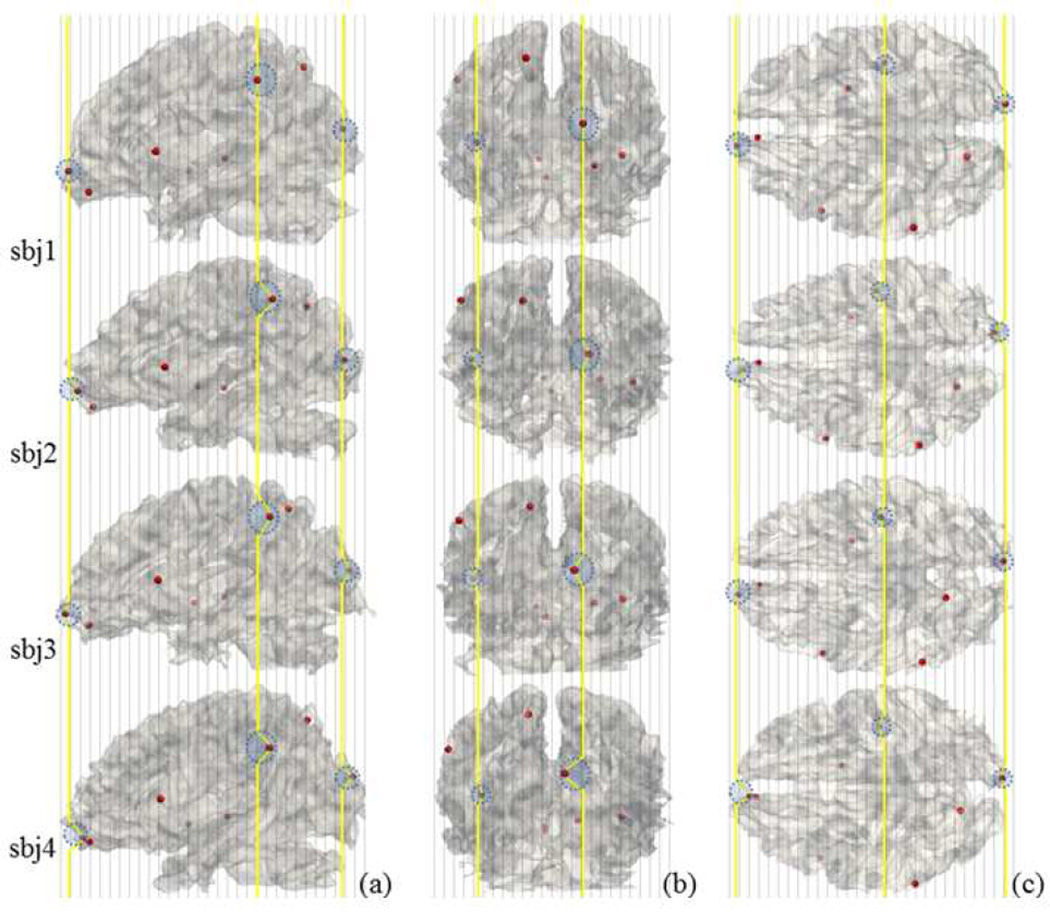
As these 358 DICCCOLs have intrinsic structural correspondences across different brains, we aim to examine the group-wise consistent activation patterns of these common structural landmarks in block-based task fMRI data as follows. First, the first-level general linear model (GLM) analysis is performed on the fMRI BOLD signal of each corresponding DICCCOL landmark in each individual subject’s own brain space (Friston et al., 1994; Woolrich et al., 2001b). Second, the consistent activation significances among the corresponding DICCCOL landmarks are statistically integrated and assessed at the group level using the mixed-effects model (Smith et al., 2004). Here, a major advantage of the DICCCOL-based fMRI activation detection is that the activation significance levels of DICCCOLs in different brains can be directly integrated and pooled without the need of intersubject image registration, which avoids the substantial inaccuracies possibly caused by the spatial alignments across individuals using image registration methods (Zhu et al., 2012). Therefore, the intrinsically-established correspondences among DICCCOLs effectively tackle the abovementioned first challenge. As an example, Fig.1 illustrates the major difference between the DICCCOL-based group-wise activation detection method and traditional group-wise activation detection methods. In traditional group-wise fMRI activation detection methods (e.g., Beckmann et al., 2003), the activation significance levels of corresponding image grid voxels in different brains are integrated, as illustrated by the gray vertical lines in Fig.1. However, due to the inaccuracy of image registration algorithms and the individual brain variability (Thirion et al., 2007; Derrfuss and Mar, 2009; Jan et al., 2009; Tahmasebi, 2010; Zhu et al., 2012), the image grid voxels have inaccurate correspondences. In fact, the anatomically corresponding landmarks might be located on an irregular curve, as annotated by the red spheres on the yellow curve. Since those anatomically corresponding landmarks across individuals represented by the red spheres can be relatively accurately determined by the DICCCOL system (Zhu et al., 2012), it becomes feasible and possible to determine group-wise activated DICCCOL landmarks directly from individual brains via statistical analyses. Essentially, these statistical inferences based on the intrinsically-established DICCCOL correspondences among a group of subjects can be more reliable and robust to the variability in individual activation magnitudes and the evoked brain networks, thus effectively dealing with the abovementioned second and third challenges in group-wise activation detection.
Fig. 1.
Conceptual comparison of DICCCOL-based activation detection and traditional group-wise activation detection methods. Four subjects were linearly warped into the MNI (Montreal Neurological Institute) atlas space. (a) (b) and (c) show 3 examples of corresponding DICCCOL landmarks, respectively. The 8 red bubbles are randomly selected from the DICCCOL system (Zhu et al., 2012). The vertical gray dashed lines represent image slices, which have the image grid point correspondences across subjects. The yellow curves show the actual correspondences of the DICCCOL landmarks in four different brains.
The proposed DICCCOL-based activation detection methods have been applied on a working memory task-based fMRI dataset with DTI images (Faraco et al., 2011; Zhu et al., 2011) and on the recently released Human Connectome Project (HCP) fMRI/DTI dataset (Barch et al., 2013), and extensive experimental results have demonstrated the reasonably good sensitivity and specificity of the methods. The rest of the paper is organized as follows. In Section 2, we detail the DICCCOL-based activation detection methods. Section 3 presents the experimental results including comparisons with previous methods and reproducibility studies. Discussions and conclusions are provided in Section 4.
2. MATERIALS AND METHODS
2.1. Overview
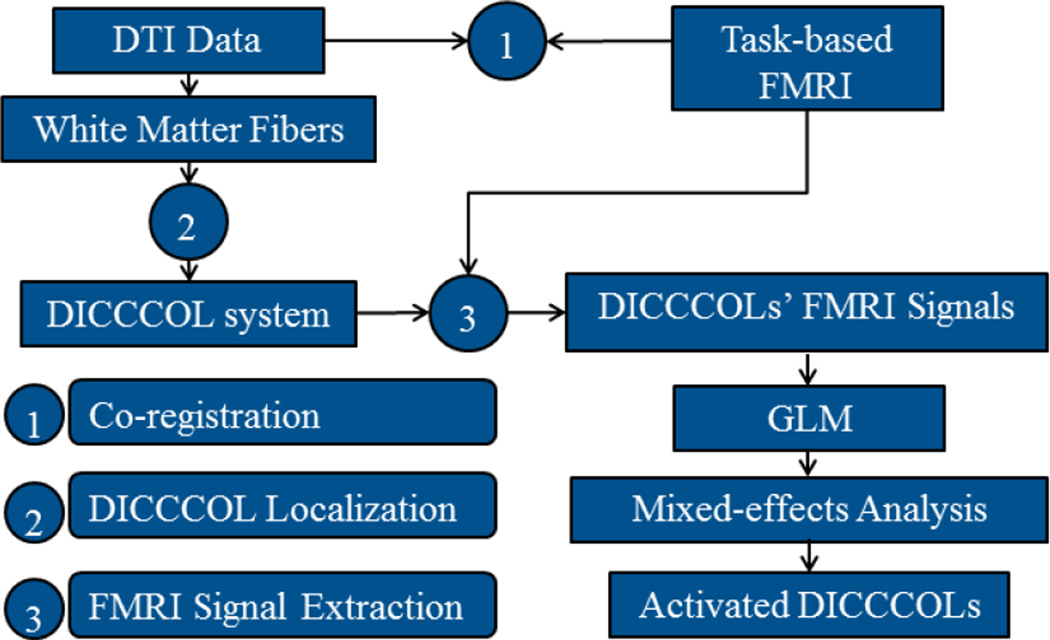
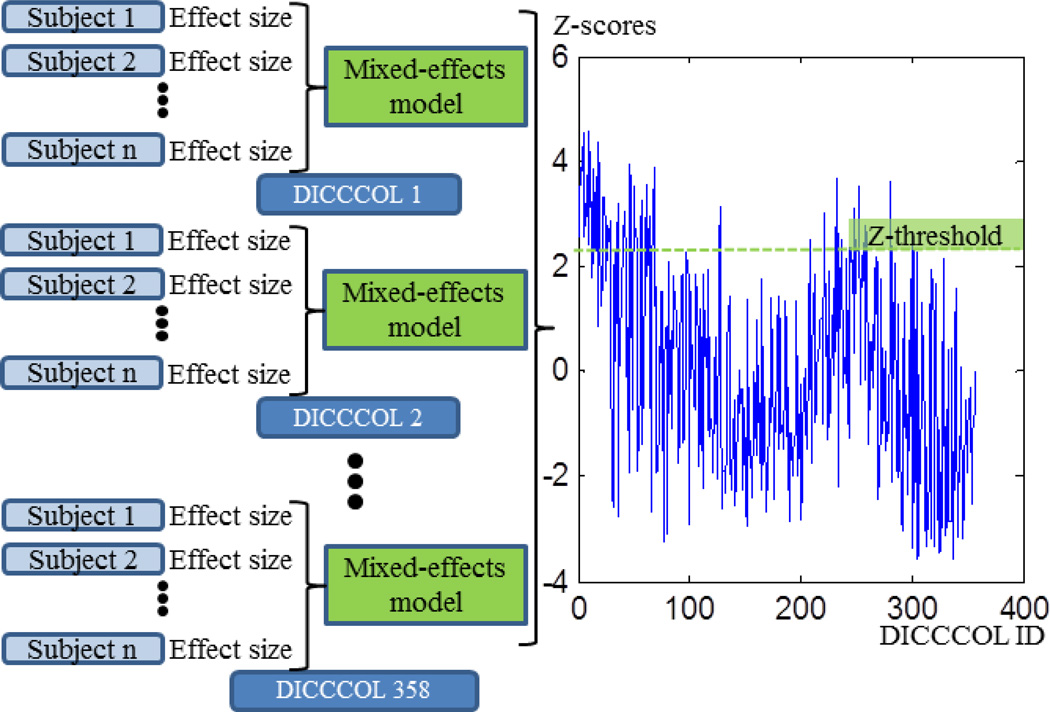
The computational pipeline of our methods is summarized in Fig.2. First, DTI and task-based fMRI images are co-registered in the same fMRI image space using the FSL FLIRT registration toolkit (http://www.fmrib.ox.ac.uk/fsl/). White matter fibers are tracked from DTI data via MedINRIA (http://www-sop.inria.fr/asclepios/software/MedINRIA/). Afterwards, we located and optimized 358 DICCCOL landmarks on individual cortical surfaces via the approaches in Zhu et al., 2012. With the co-registered DTI and task-based fMRI data, we extracted fMRI BOLD time series for each DICCCOL landmark. The commonly used general linear model (GLM) is then applied on these fMRI time series individually to estimate the response effect size for each landmark. As the 358 DICCCOL landmarks possess intrinsic structural correspondences (Zhu et al., 2012), we performed group-wise mixed-effect statistics on each landmark’s effect sizes obtained from different brains for the purpose of detecting group-wise consistently activated landmarks.
Fig. 2.
The computational pipeline of DICCCOL-based fMRI activation detection methods.
2.2. Data acquisition and pre-processing
Dataset 1
In an operational span (OSPAN) working memory task-based fMRI experiment under IRB approval (Faraco et al., 2011), 19 subjects were scanned and fMRI images were acquired on a 3T GE Signa scanner at the Bioimaging Research Center of The University of Georgia. Briefly, acquisition parameters were as follows: fMRI: 64×64 matrix, 4mm slice thickness, 220mm FOV, 30 slices, TR=1.5s, TE=25ms, ASSET=2. Each participant performed a modified version of the OSPAN task (3 block types: OSPAN, Arithmetic, and Baseline) while fMRI data was acquired (Faraco et al., 2011). DTI data was acquired with dimensionality 128×128×60, spatial resolution 2mm×2mm×2mm; parameters were TR 15.5s and TE 89.5ms, with 30 DWI gradient directions and 3 B0 volumes acquired. The fMRI data was co-registered with the DTI image space using a linear transformation via FSL FLIRT. For fMRI images, the preprocessing pipelines included motion correction, slice time correction, global drift removal, temporal pre-whitening, (Li et al., 2010a; Zhu et al., 2011; Zhu et al., 2012). For DTI data, preprocessing included skull removal, motion correction and eddy current correction (Liu et al., 2007). Brain tissue segmentation was conducted on DTI data using the approach in Liu et al., 2007. The cortical surface was reconstructed from the brain tissue maps using in-house software (Liu et al., 2007). The whole-brain streamline fiber tracking was performed using the MedINRIA package.
Dataset 2
The publicly available fMRI/DTI data from the Human Connectome Project (HCP) Q1 release. In the HCP Q1 release dataset, the task-based fMRI data was collected on 68 participants with 7 task designs, which are working memory, gambling, motor, language, social cognition, relational processing and emotion processing (Barch et al., 2013). The acquisition parameters of fMRI data are as follows: 90×104 matrix, 220mm FOV, 72 slices, TR=0.72s, TE=33.1ms, flip angle = 52°, BW =2290 Hz/Px, in-plane FOV = 208 × 180 mm, 2.0 mm isotropic voxels. For task fMRI images, the preprocessing pipelines included motion correction, spatial smoothing, temporal pre-whitening, slice time correction, global drift removal. The detailed task description and paradigm are referred to Barch et al., 2013. In this paper, we used the fMRI data of emotion task and working memory task as an independent large-scale dataset to evaluate and validate our methods.
2.3. DICCCOL landmark prediction
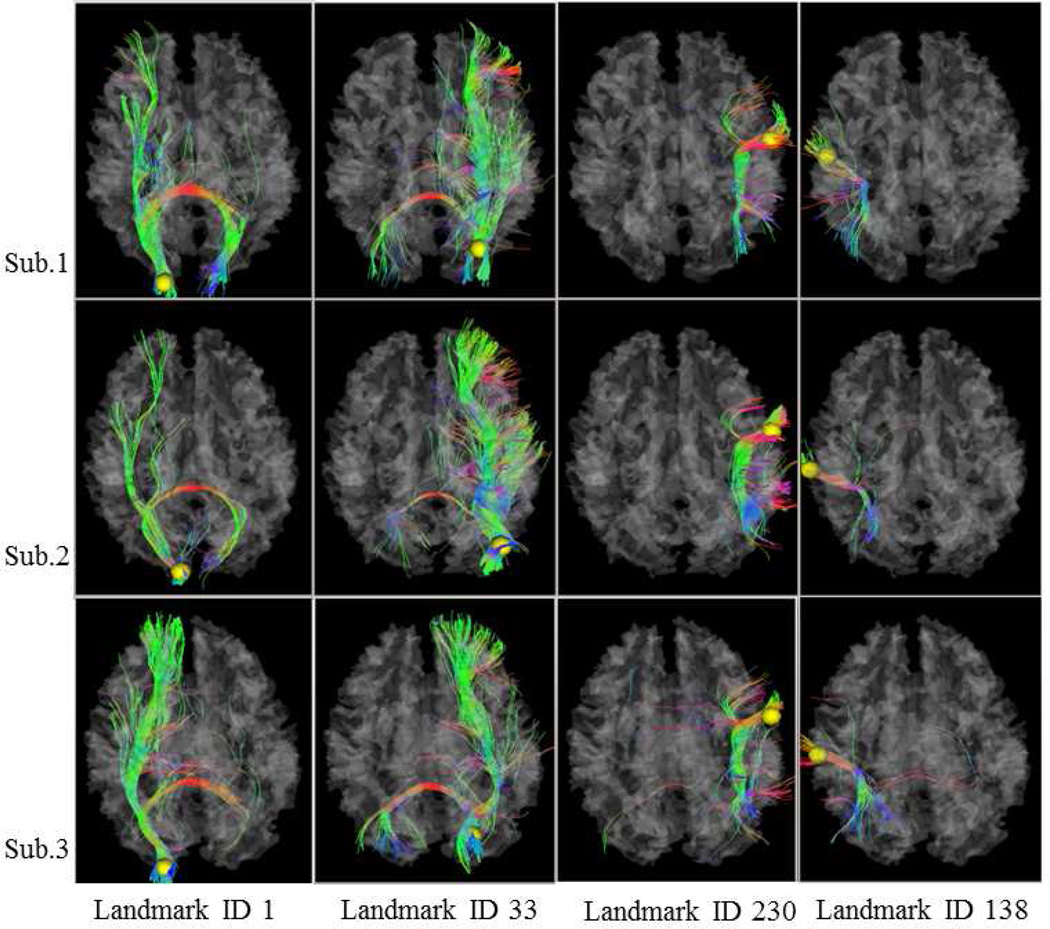
For each subject with DTI data, the 358 DICCCOL landmarks were predicted via the approaches in (Zhu et al., 2012; Zhang et al., 2011b). Briefly, the group-wise consistent fiber connection patterns from ten template brains were used as the predictive models of each cortical landmark. In particular, the DTI-derived fiber connection patterns are quantitatively described by the trace-map model (Zhu et al., 2011; Zhu et al., 2012), which represents the global shape and connectivity pattern of a fiber bundle on a standard unit sphere. As a result, the fiber bundles emanating from cortical regions within and across individual brains can then be effectively and efficiently compared on the standard sphere space. Then, we searched within a neighborhood of a linearly warped candidate location in the new subject brain, and identified the location with the most similar fiber connection pattern as those in the ten template brains. This search process is akin to the landmark optimization procedure in (Zhu et al., 2011; Zhu et al., 2012). Fig.3 shows 4 randomly selected landmarks and their consistent fiber connection patterns in 3 subjects. Extensive experiments have already demonstrated that the predicted landmarks possess good fiber consistence across subjects and the landmark localization is quite accurate (Zhu et al., 2012).
Fig. 3.
Examples of DICCCOL landmark prediction. Randomly selected 4 landmarks in 3 subjects are visualized here. Yellow spheres are DICCCOL landmarks. For the same landmark, DTI-derived fiber connections are visualized across subjects. Additional visualizations of other DICCCOL fiber connection patterns are available at: http://dicccol.cs.uga.edu.
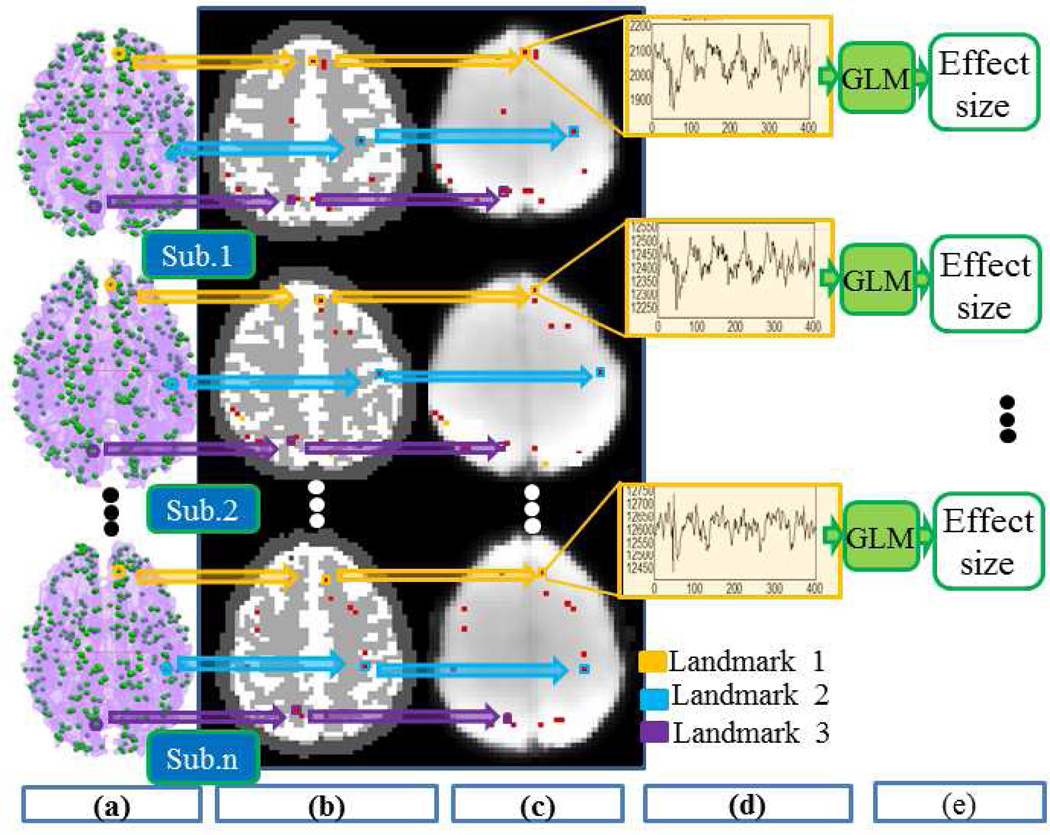
Fig. 4.
Illustration of the extraction of cortical landmarks’ fMRI signals and the regression of stimulus curve to them via GLM. (a) Visualizations of 358 DICCCOLs (green bubbles) on the cortical surfaces in three subjects. (b) Visualizations of the selected DICCCOLs (red dots) on the DTI-derived brain tissue maps. (c) Visualization of the selected DICCCOLs (red dots) on fMRI raw images. In (a) (b) and (c), circles and boxes in yellow, blue and purple colors are examples of three corresponding landmarks across three different subjects. (d) Visualization of the fMRI BOLD time series of one selected landmarks from three subjects. (e) With GLM, the effect sizes are estimated for each landmark.
2.4. DICCCOL-based activation detection
2.4.1. FMRI signal extraction and individual effect size estimation
The DTI images of each subject were registered with the fMRI images via FSL FLIRT. The brain tissue segmentations were performed on the DTI-derived FA (fractional anisotropy) and ADC (apparent diffusion coefficient) images via the approaches in Liu et al., 2007. As mentioned in Lv et al., 2010, gray matter fMRI signals are much more meaningful than those of white matter voxels, but the surface reconstruction method cannot guarantee each surface vertex is located in gray matter (Liu et al., 2007). Therefore, we firstly searched the nearest gray matter voxel with the guidance of DTI-based tissue segmentation map in fMRI space for each landmark on the cortical surface (Li et al. 2010b; Ge et al., 2011). Fig.4 illustrates this process (from the left (Fig.4a) to the right (Fig.4d)). It is interesting that the fMRI time series extracted for the same landmark from three brains exhibit similar time course shapes, suggesting that the three landmarks could be consistently activated in response to the stimuli.
With the data processing pipeline in Figs.4a-4d, we extracted fMRI signals for each DICCCOL landmark of each subject. Then, for the fMRI time series of each landmark, the GLM model (Friston et al., 1994; Worsley et al., 1997) was applied to estimate the effect size to stimulus blocks. Notably, we extracted and used the GLM source codes implemented in the FSL FEAT package for this work. In traditional activation detection, the effect size of each fMRI time series in each voxel is used to perform the mixed-effects analysis, and afterwards the derived z-score is used to measure the significance level of activation. Here, we conduct the same regression on the fMRI time series of DICCCOL landmarks, but the estimated effect sizes are used to perform the group-wise mixed-effects analysis, as explained in the next section.
2.4.2. Group-wise mixed-effects analysis
Although the 358 DICCCOL landmarks have structural correspondence across subjects, different brains may not necessarily respond to external stimuli in the same way. That is, there are variabilities in individual activation magnitudes and the evoked brain networks (Smith et al., 2005; Thirion et al., 2007; Derrfuss and Mar, 2009; Laird et al., 2009). Therefore, we applied a multi-subjects analysis to explore the group-wise activation significance of each landmark among a group of subjects. Our rationale here is the same as those in other group-wise fMRI activation detection methods (Beckmann et al., 2003; Woolrich et al., 2004b; Thirion et al., 2007; Ng et al., 2010), that is, group-wise approach improves the statistical power and reliability of individual fMRI studies. Specifically, for each landmark, we first set the estimated effect sizes from a group of subjects, which were generated from the application of GLM in individual brains, as the input of the mixed-effects model (Everitt and Bullmore, 1999) via the tool of FSL FLAME (Smith et al., 2004). Specifically, inter-subject random-effects component of the mixed-effects variance was modeled and estimated using the sophisticated estimation techniques, and by using MCMC we get an accurate estimation of the true random-effects variance and degree of freedom at each DICCCOL (Beckmann et al., 2003; Woolrich et al., 2004b). Single group t-test was employed to measure the average activation level for each DICCCOL, and further the translated z-scores are used to measure the group-wise activation significance of each DICCCOL landmark (Beckmann et al., 2003; Woolrich et al., 2004b), as shown in Fig.5. Afterwards, we determined the activated DICCCOL landmarks with a threshold to the derived z-scores.
Fig. 5.
Group-wise mixed-effects analysis using effect sizes of a group of n subjects. Effect sizes estimated by GLM for each DICCCOL landmark in n subjects are pooled together as the input of mixed-effects model, and the derived z-score of each landmark is a measurement of activation significance. With a threshold to z-cores, the activated DICCCOL landmarks are announced.
3. RESULTS
In this section, we present a series of experiments to assess the consistencies of functional performances of the corresponding DICCCOL landmarks across subjects (Section 3.1), to examine the influences of spatial smoothing and image registration in group-wise activation detections (Section 3.2), to perform DICCCOL-based group-wise activation detection and compare it with other methods (Section 3.3), to conduct quantitative comparisons of group-wise activation detection methods (Section 3.4), to perform analysis of sensitivity and specificity (Section 3.5), and to perform reproducibility analysis (Section 3.6). All of these experiments were performed on the multimodal fMRI/DTI datasets in Faraco et al., 2011 and Zhu et al., 2011 and the HCP Q1 release dataset (Barch et al., 2013), which were pre-processed via the approaches in Section 2.2.
3.1. Assessment of consistencies of DICCCOL activations
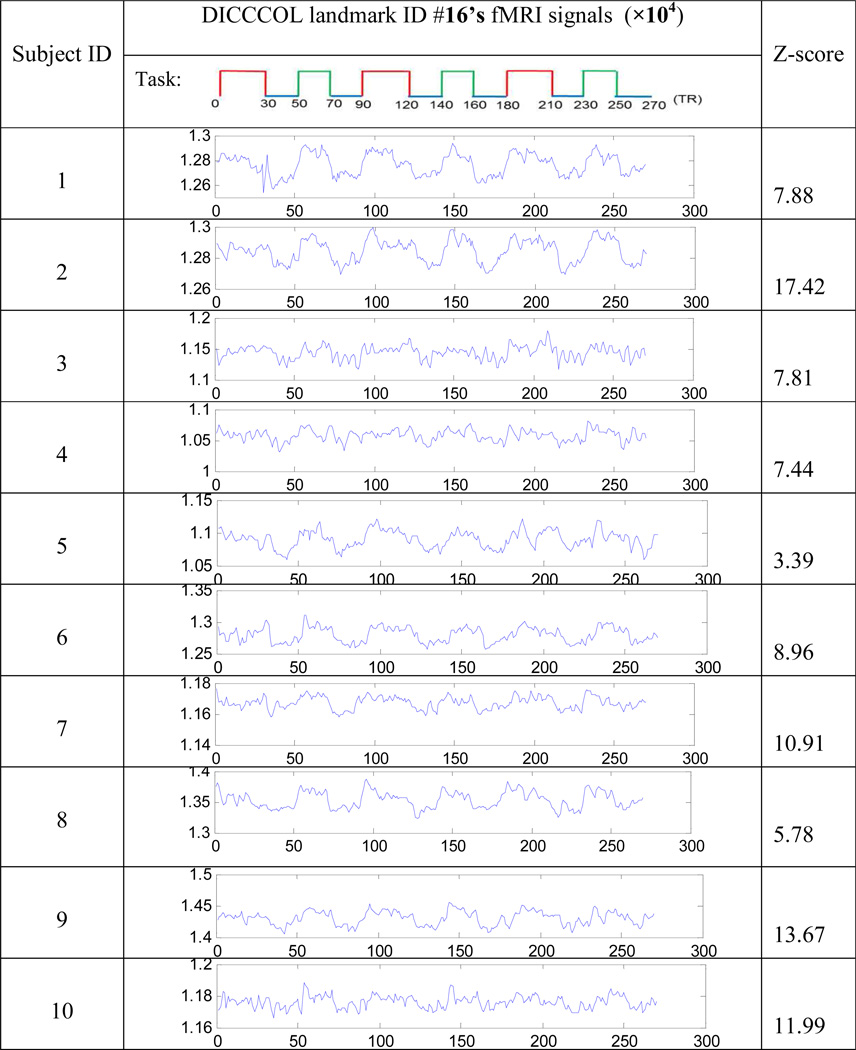
Although there are notable variations in individual functional activities (Smith et al., 2005; Thirion et al., 2007; Derrfuss and Mar, 2009; Laird et al., 2009), fortunately, there are still common activation patterns among different human brains (Beckmann et al., 2003; Smith et al., 2004). In this section, we aim to assess the consistency of DICCCOLs’ functional performance in a group of subjects. Specifically, for each brain, we first individually perform the first-level GLM analysis on fMRI signals of 358 DICCCOLs via FSL FEAT with the overall stimulus curve, as detailed in Section 2.4.1, and the derived z-scores are used to measure the functional activation significance of DICCCOLs. As an example, Table 1 shows the fMRI signals and z-scores of DICCCOL #16 in randomly selected 10 subjects. Although these fMRI BOLD signals exhibit different local curve patterns, they still exhibit similar overall shapes in response to the block-based task stimulus curve (the top row in Table 1). Importantly, the significance z-scores across these 10 subjects are consistently high (the right column in Table 1), suggesting the group-wise consistent activation of this DICCCOL landmark in response to the block-based task. Notably, the z-scores for the same DICCCOL landmark in 10 subjects also show considerable variation, e.g., varying from 3.39 in the fifth subject to 17.42 in the second subject. Fortunately, the statistical characteristics such as the high mean (9.53) of the z-score distribution among this group of subjects allow us to reliably assess the group-wise activation level and the consistency of these landmarks.
Table 1.
FMRI signals (the middle column) and corresponding z-scores (the right column) of an example DICCCOL landmark (#16) in 10 randomly selected subjects (IDs in the left column). The block-based stimulus curve is in the top row.
 |
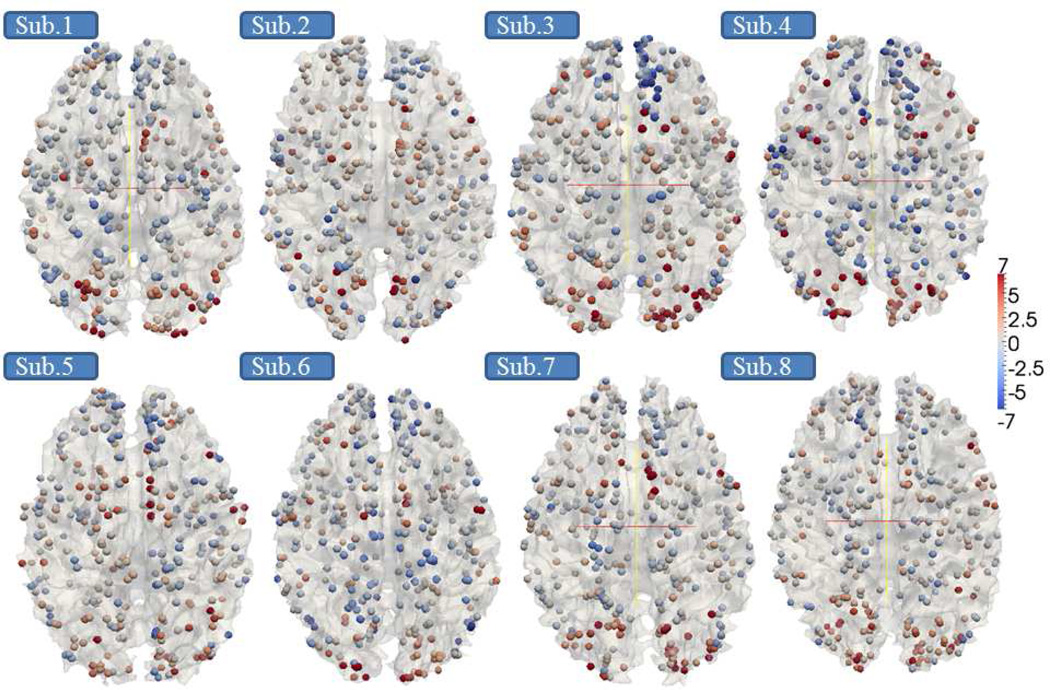
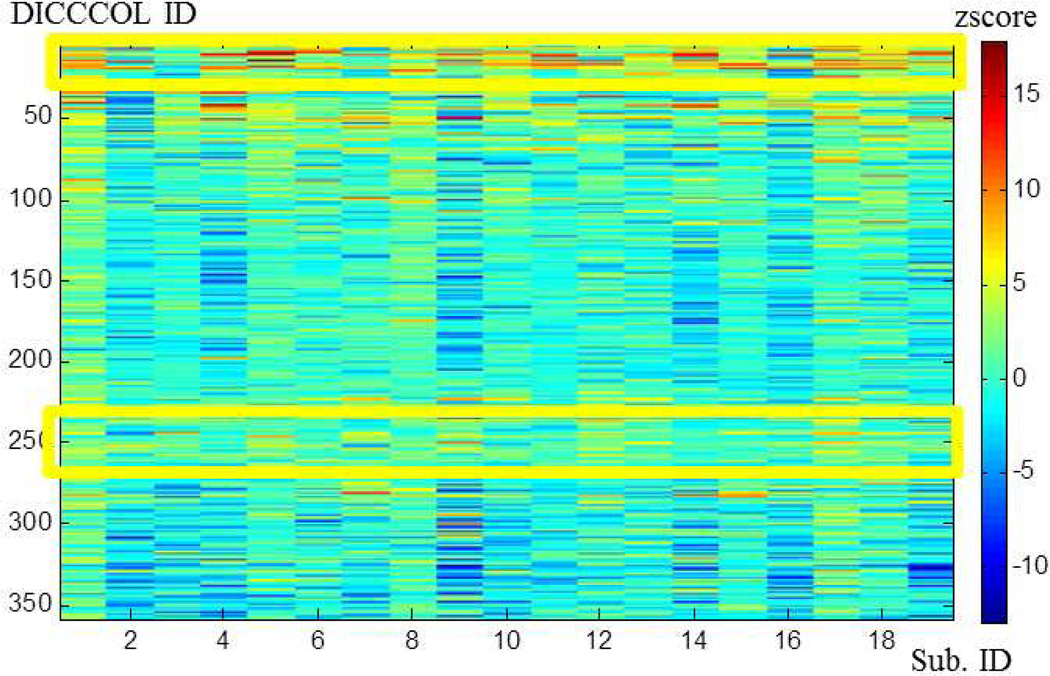
Afterwards, we mapped the derived individual z-scores of DICCCOLs back to their locations with colors. Eight randomly selected subjects are shown in Fig.6. Although these 358 landmarks’ z-scores show different magnitudes and contrasts across different brains, the spatial distributions of the highly activated regions are reasonably similar. These results suggest the feasibility of performing group-wise activation detection via the DICCCOL landmarks. This visualization result is in agreement with previous literature reports (Smith et al., 2005; Thirion et al., 2007; Derrfuss and Mar, 2009). To better visualize the consistency, as well as the variability of the DICCCOL activation levels, we stacked all 358 landmarks’ z-scores across 19 subjects in the group into a matrix and color-coded them in Fig.7. Notably, the same color bar with scale from -10.0 to 15.0 is set in Fig.7 for ease of comparison across subjects. In Fig.7, each column contains the z-scores of 358 DICCCOL landmarks in one subject, and each row contains z-scores of the same DICCCOL landmarks in a group of 19 subjects. The DICCCOL landmarks are in the same original order (Zhu et al., 2012). It is interesting that we can see similar overall DICCCOL activation patterns across subjects. It is evident that the DICCCOL landmarks in the yellow blocks in Fig.7 exhibit consistent high z-scores across subjects.
Fig. 6.
The z-score maps of 358 DICCCOLs from 8 randomly selected subjects.
Fig. 7.
The distribution of z-scores of 358 landmarks from 19 subjects. The horizontal x-axis represents subject IDs, and the vertical y-axis represents DICCCOL IDs.
In order to further quantitatively measure the consistency of z-score distributions across 19 subjects, we calculated the Cronbach’s α (Cronbach, 1951) of them. Specifically, in the z-score matrix Z in Fig.7, which contains z-scores from K subjects, Zi represents z-score vector with n DICCCOL landmarks in Eq.(1).
| (1) |
The Cronbach’s α is calculated as below, where is the variance of z-scores of each subject, and is the variance of the z-score matrix of Z in Eq.(2).
| (2) |
Here K=19 and n=358. The calculated α of the z-score matrix is 0.88, which presents high consistency of z-score distribution across subjects. This result further supports that it is feasible to perform group-wise activation detection based on the DICCCOL landmarks, despite the considerable variation in the individual landmark’s activation levels across different subjects.
3.2. Assessment of the influences of spatial smoothing and image registration
Traditional voxel-based fMRI activation detection methods, including group-wise activation detection approaches (Friston et al., 1996; Beckmann et al., 2003; Smith et al., 2004; Mikl et al., 2008; Tahmasebi et al., 2009; Tahmasebi, 2010; Yue et al., 2010; Li et al., 2012e), usually rely on image registration and/or spatial smoothing steps to establish correspondences of voxels or groups of voxels across different subjects. In this section, we revisit and examine the influences of spatial smoothing and image registration on the fMRI activation detection, particularly, in the context of DICCCOL-based activation detection.
3.2.1. The influence of spatial smoothing
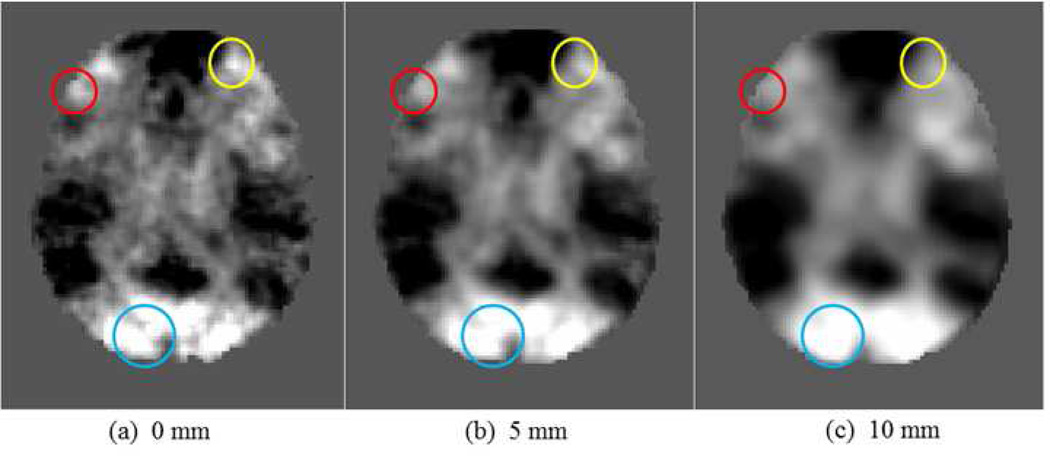
In traditional activation detection methods including group-wise approaches, spatial smoothing is usually implemented during the pre-processing of fMRI data of each brain in the group. In general, spatial smoothing with a Gaussian kernel facilitates finding the intersections of activation foci across different subjects (e.g., Mikl et al., 2008; Yue et al., 2010; Li et al., 2012e) and further detecting commonly activated regions. However, this spatial smoothing step could also potentially result in adding false positives and/or false negatives during the activation detection, as already pointed out in a variety of previous studies (e.g., Mikl et al., 2008; Yue et al., 2010; Li et al., 2012e). As an example, Fig.8 presents a series of z-score maps with different smoothing FWHM (Full Width Half Maximum) sizes. Here, 0 mm means no spatial smoothing. In Fig.8, the bright regions with higher z-score are potential fMRI activations. It is evident that with the increase of the FWHM of Gaussian kernel, the borders of bright regions in the blue circles become blurred and finally disappear, which makes the two bright regions in the blue circle merge into one (Fig.8c). This type of spatial smoothing effect would possibly cause the sacrifice of spatial resolution of fMRI activation detection. In contrast, the small activated region in the red circles is weakened and even disappears with the increase of the FWHM, as shown in Figs.8a-8c. This type of spatial smoothing effect would possibly cause the false negatives in fMRI activation detection. That is, the sensitivity of activation detection is degraded. Meanwhile, the activation centers in the yellow circles shifts with the increase of the FWHM, which has already been demonstrated in our prior studies in Li et al., 2010a and Li et al., 2012d. Therefore, this type of spatial smoothing effect would result in the false positive or inaccuracy in activation detection. Based on the typical examples shown in Fig.8, we can see that the spatial smoothing step, if applied before the individual or group-wise activation detections, could possibly result in several downside effects including border blurring, weakening small region activation (Tahmasebi et al., 2009), and shifting activation centers (Li et al., 2012d). Thus, in the proposed DICCCOL-based activation detection methods in this paper, we do not perform spatial smoothing during the activation detection procedures.
Fig. 8.
Examples of z-score maps with different sizes of smoothing FWHM. The three circles with different colors highlight three different types of spatial smoothing effects. With increasing the FWHM of spatial smoothing, the borders of bright regions in the blue circles become blurred and finally disappear; the small activated region in the red circles is weakened and even disappears; the activation centers in the yellow circles shifts.
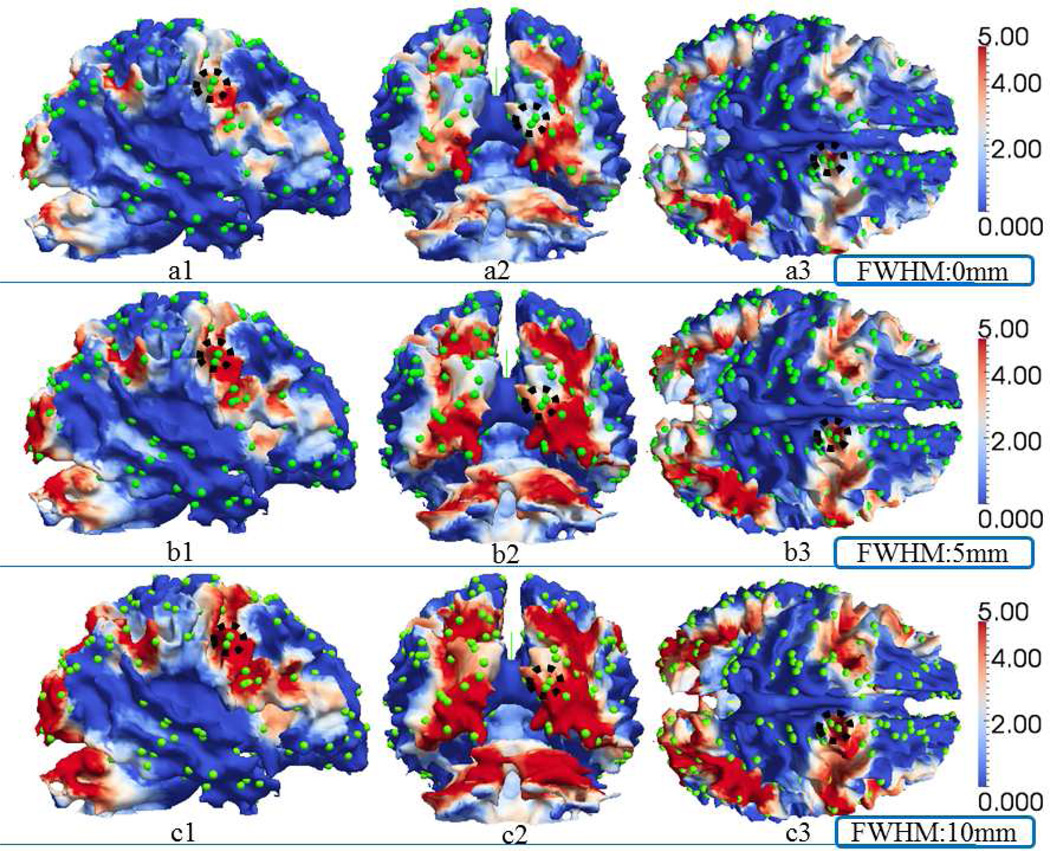
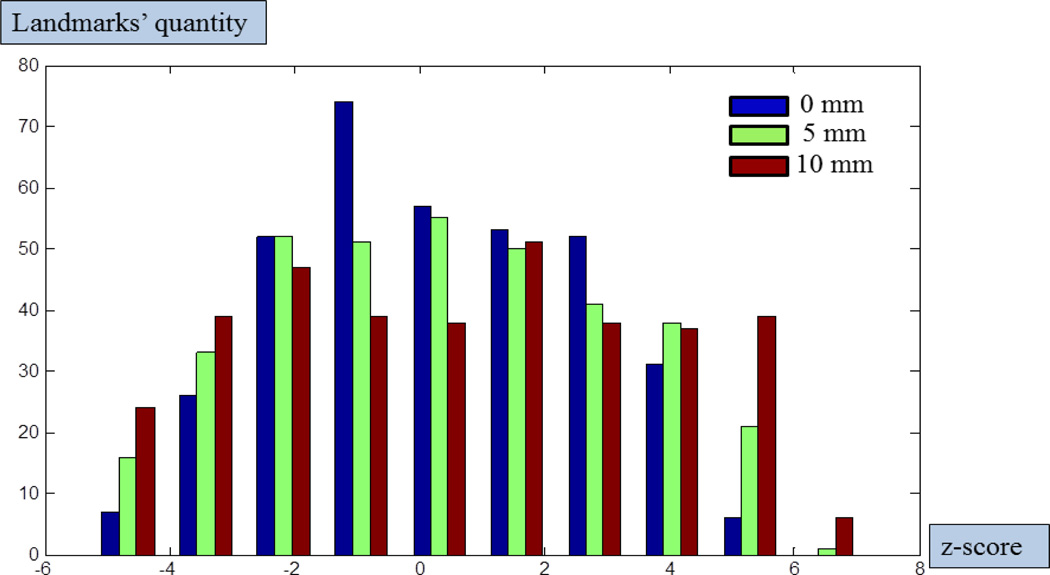
For better 3D visualization, we also mapped the traditional group-wise z-scores using the above three different FWHM settings of spatial smoothing back to the cortical surfaces in MNI standard space, as shown in Fig.9. The green spheres in Fig.9 are overlaid DICCCOL landmarks. In Fig.9, when the FWHM increases, the red areas with higher z-scores will expand and involve more landmarks (from the top row to the bottom row in Fig.9), which are likely to be false positives. Three examples of these possible false positive activation detections with increasing smoothing FWHMs are highlighted by the black dashed circles in Fig.9. This example further justifies our method of not performing spatial smoothing during the preprocessing step, which is in line with other similar suggestions made in Bowman et al., 2008. In addition, the histograms of z-scores at the locations of the 358 DICCCOL landmarks are presented in Fig.10. It is evident that larger FWHMs will equalize the distributions of z-scores, and potentially increase the false positives, as shown in Fig.10.
Fig. 9.
Z-score maps of group-wise activation detection with different FWHMs in the spatial smoothing steps in one randomly selected subject. Rows of a, b and c represent the results of using FWHM 0mm, 5mm and 10mm, separately, and columns 1, 2 and 3 show three different views of the subject. Green spheres represent the DICCCOL landmarks.
Fig. 10.
Distributions of 358 DICCCOL landmarks’ group-wise z-scores with different sizes of smoothing windows. Blue bins represents 0 mm FWHM (means no smoothing), green bins and red bins represent 5 mm, 10 mm FWHMs, separately. The x-axis represents z-scores, and the y-axis represents the quantity of landmarks.
3.2.2. The influence of image registration
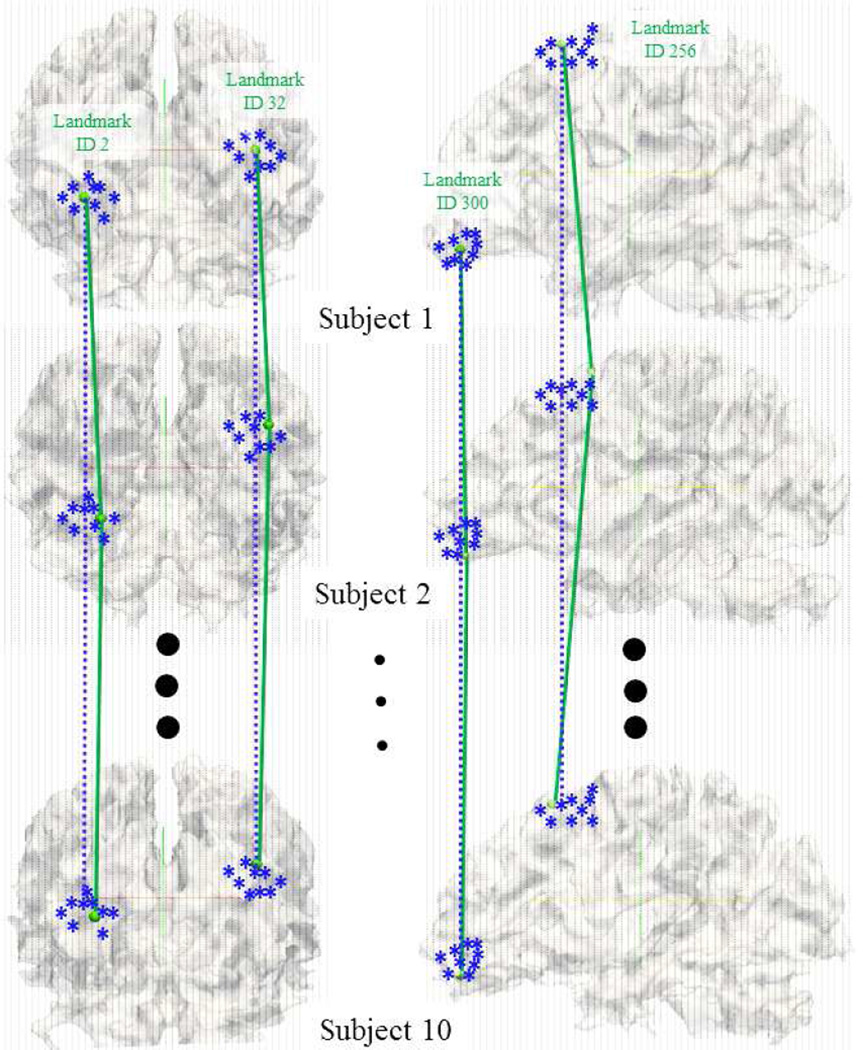
A variety of literature reports have demonstrated that current image registration algorithms have difficulty in dealing with the remarkable anatomic variation of individual brains (e.g., Derrfuss and Mar, 2009; Yap et al., 2011; Zhang et al., 2011a; Jia et al, 2010; Asman et al., 2011). Our recent studies in Zhu et al., 2012 have shown that the landmark localization accuracy by DICCCOL is substantially better than several widely-used image registration algorithms such as FSL FLIRT, FSL FNIRT (Andersson et al., 2008), ANTS (Avants et al., 2008) and HAMMER (Shen and Davatzikos, 2002). Here, to illustrate the influence of image registration on group-wise fMRI activation detection, we first registered 10 randomly selected subjects’ brain images to the MNI space via the FSL FLIRT image registration tool, and the voxel correspondence built up by the registration is illustrated by gray dash grids in Fig.11. The same transform matrix was applied to DICCCOL landmarks in order to register them to the MNI space. In Fig.11, the green spheres represent 4 randomly selected DICCCOLs registered in the MNI space. However, the registration method will miss the actual correspondence of our DICCCOL landmarks (as illustrated by the green lines), but find the corresponding voxel locations as illustrated by the blue dash lines. As a result, with the image registration, for each corresponding DICCCOL landmark there are 10 counterpart landmark locations in the MNI space from 10 subjects, as represented by the blue stars in Fig.11. Additionally, we performed the transformation matrix to the individually detected z-score maps of the 10 subjects, based on which we compared the performances of functional correspondences established by image registration and by our DICCCOL system. Specially, we extracted the individual z-scores of both our DICCCOL locations (green spheres) and counterpart locations (blue stars) from individual z-scores maps of 10 subjects in the MNI space, respectively. The standard deviations of z-scores of blue stars (corresponding voxels) and the green spheres (corresponding DICCCOL landmarks) from 10 subjects in Fig.11 are provided in Table 2. It is evident that the z-values of green spheres possess lower standard deviations than the blue stars, suggesting that the correspondence established by our DICCCOL system performs better than that obtained by the image registration method. In addition, we performed a global comparison of the standard deviation of individual z-scores on all DICCCOLs and all volumetric voxels. The average standard deviation of all DICCCOLs’ z-scores is 1.86, while the average standard deviation of all volumetric voxels’ z-scores, whose correspondences were achieved by image registration, is 2.76. Therefore, this comparison shows that the DICCCOL system is capable of establishing better correspondence across different brains.
Fig. 11.
Voxel-wise correspondences established by image registration and the correspondences among DICCCOL landmarks (4 randomly selected landmarks are shown here). Blue stars are the registered and warped locations of DICCCOL landmarks in the MNI space from different subjects. Their grid point correspondences are illustrated by the blue dashed lines. The correspondences of DICCCOL landmarks are illustrated by the green solid lines.
Table 2.
Comparison of standard deviations of individual activation z-scores for registered voxels (blue stars) and DICCCOL landmarks (green spheres) in Fig.11.
| Standard deviations of z-scores |
Landmark ID #2 |
Landmark ID #32 |
Landmark ID #256 |
Landmark ID #300 |
|---|---|---|---|---|
| Corresponding voxels | 2.14 | 2.38 | 2.26 | 2.11 |
| Corresponding DICCCOLs | 1.55 | 1.57 | 1.24 | 1.42 |
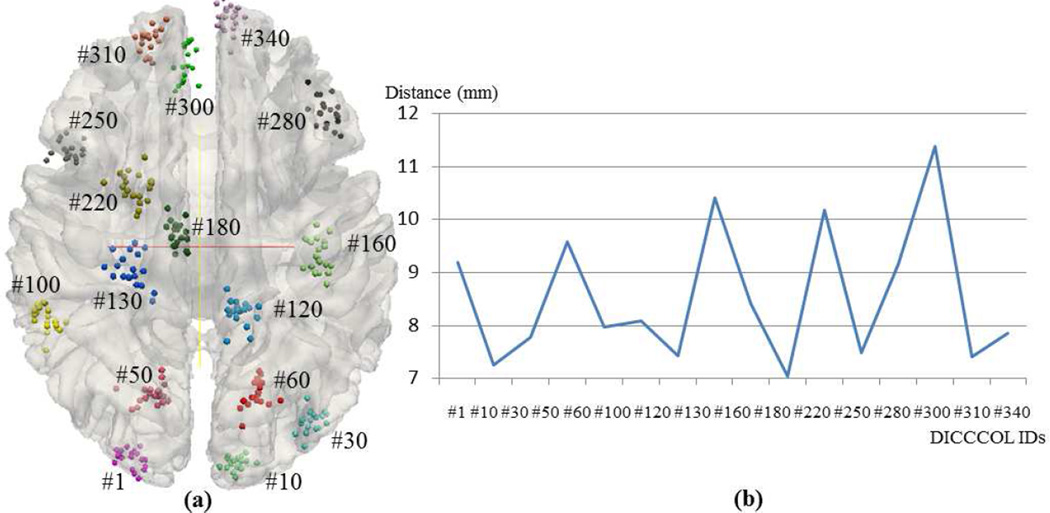
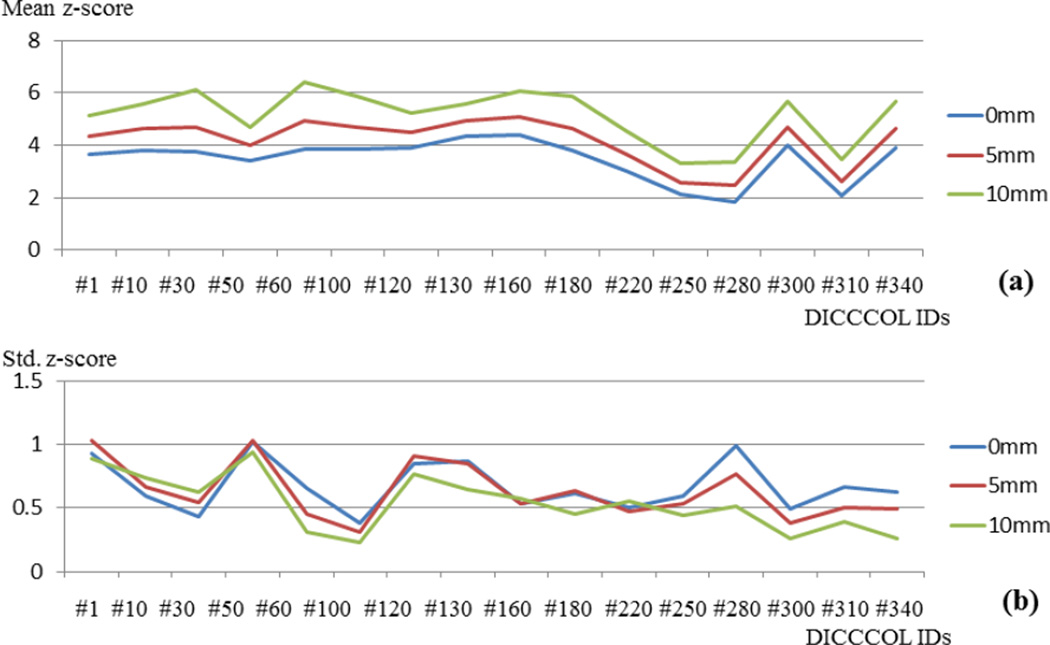
For additional quantitative analysis, we similarly registered 19 subjects’ DTI image into the MNI space via the FSL FLIRT registration tool, and applied the same transform matrix to their corresponding DICCCOL locations to warp DICCCOLs to the MNI space. As a result, for each corresponding DICCCOL landmark, there are 19 counterpart landmarks from 19 subjects that are registered to the MNI space. Fig.12a visualizes 16 random selected example DICCCOLs on the cortical surface of the MNI space with different colors. For each DICCCOL set with the same color, we calculated the average distance among the 19 registered locations and plotted them in Fig.12b. We can see that the registration method has an average distance from 7.0 mm to 11.5 mm. Further, for each example DICCCOL set in Fig.12a (in the MNI space), we measured the average z-scores and standard deviations of z-scores at the DICCCOL locations and for the z-score maps via traditional voxel-based group-wise activation detection method. These z-scores are from three experiments without spatial smoothing (FWHM: 0mm), with spatial smoothing (FWHM: 5mm), and with spatial smoothing (FWHM: 10mm), as visualized by the blue, red and green curves, respectively in Fig.13. The comparison of the three curves in Fig.13a and Fig.13b suggests that spatial smoothing only shifts the average z-score curve to a higher level, but does not necessarily decrease the stand deviation of z-scores.
Fig. 12.
(a) Registered locations of 16 randomly selected DICCCOL landmarks from 19 subjects. Different colors represent different DICCCOLs, and spheres of the same color represent each corresponding DICCCOLs registered from 19 subjects. (b) The average distances of the 16 randomly selected landmarks.
Fig. 13.
(a) The average group-wise z-scores of the 16 DICCCOL landmarks extracted by the locations of same color in Fig.12a. (b) The standard deviation of group-wise z-scores of the 16 DICCCOL landmarks extracted by the locations of same color in Fig.12a.
3.3. Group-wise activation detection results and comparisons
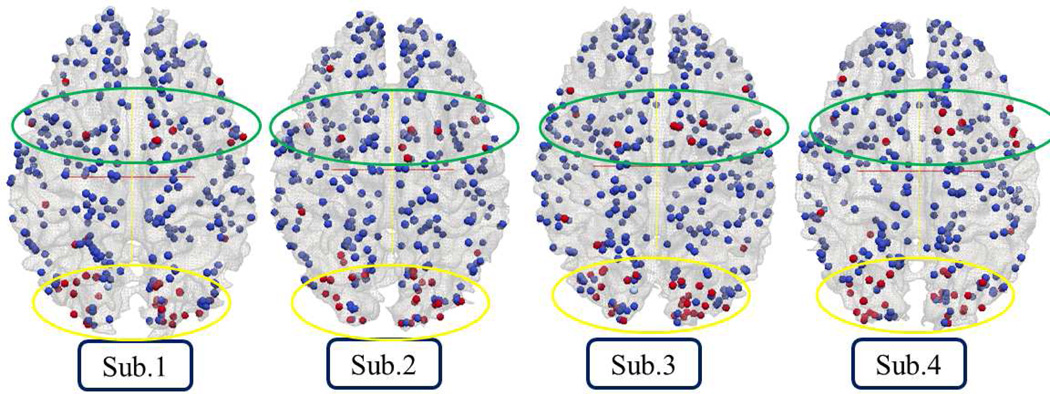
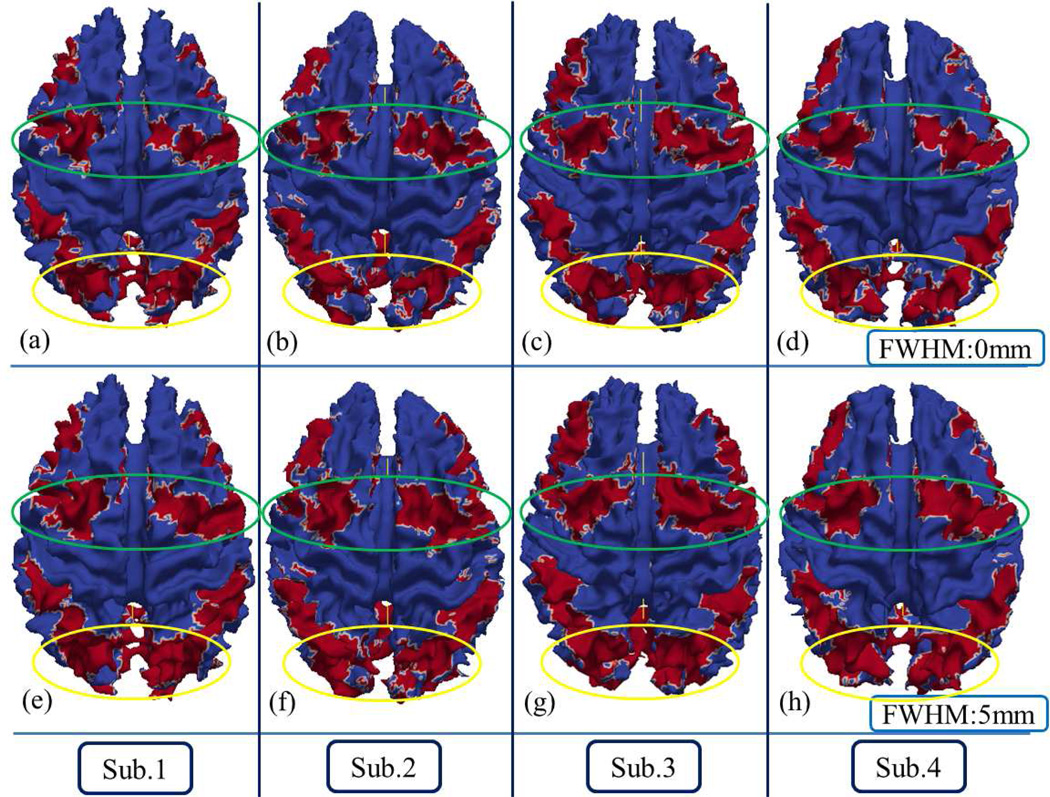
We applied the DICCCOL-based group-wise activation detection methods in Section 2.4 on a group of 19 subjects. With a threshold of z-score>2.5 and p=0.05, we detected activated DICCCOLs and mapped them with red color for 4 randomly selected subjects in Fig.14. For comparison purpose, we also mapped activations detected by the traditional method of FSL FEAT/FLAME with different spatial smoothing parameters to the cortical surfaces of the same 4 subjects, as visualized in Fig.15. From the comparison of Fig.14 and Fig.15, we can observe two advantages of our method. First, our method can effectively assess group-wise activation significance of each landmark even when the landmarks are close to each other on the same gyrus or adjacent gyri, e.g., those on the visual cortex highlighted in the yellow circles. However, with the same threshold, the traditional method of FSL FEAT/FLAME only detects large vague regions in the yellow circles, which has lower anatomical resolution and specificity. In other words, our method possesses higher spatial and anatomical resolution and accuracy. Second, as discussed in Section 3.2.2, our method based on the anatomical correspondence established by the DICCCOL system is able to locate common activations across subjects more precisely. In contrast, the traditional method is based on the voxel correspondence established by image registration, which has difficulty in dealing with anatomical variations across subjects. As a consequence, if we map the activation significance level image back to different subjects’ own cortical surfaces in Fig.15, they are not necessarily located on the corresponding anatomical structures such as gyri and sulci, although the red regions in green and yellow circles possess similar image locations. In comparison, in the green and yellow circles in Fig.14, the corresponding activated DICCCOL landmarks are ensured to have the same anatomical structures. Hence, although the DICCCOL landmarks are not able to cover the whole cortex currently, the anatomical correspondence established by DICCCOL is substantially better than traditional image registration methods.
Fig. 14.
Group-wise activations by our DICCCOL-based method for 4 randomly selected subjects. The red spheres are activated DICCCOLs and the blue ones are not activated.
Fig. 15.
Activations by traditional group-wise activation detection method of FSL FEAT with different spatial smoothing settings are mapped to the cortical surfaces. Threshold for selection activation is zscore>2.5 and p=0.05. Red regions are activations with the threshold, and blue regions are not activated regions. The 4 subjects are corresponding to the 4 subjects in Fig.14 in MNI space. Group-wise activation volume was mapped to each surface respectively. (a-d) are activations without spatial smoothing (FWHM =0mm), and (e-h) are activations with spatial smoothing of FWHM =5mm.
3.4. Quantitative comparisons
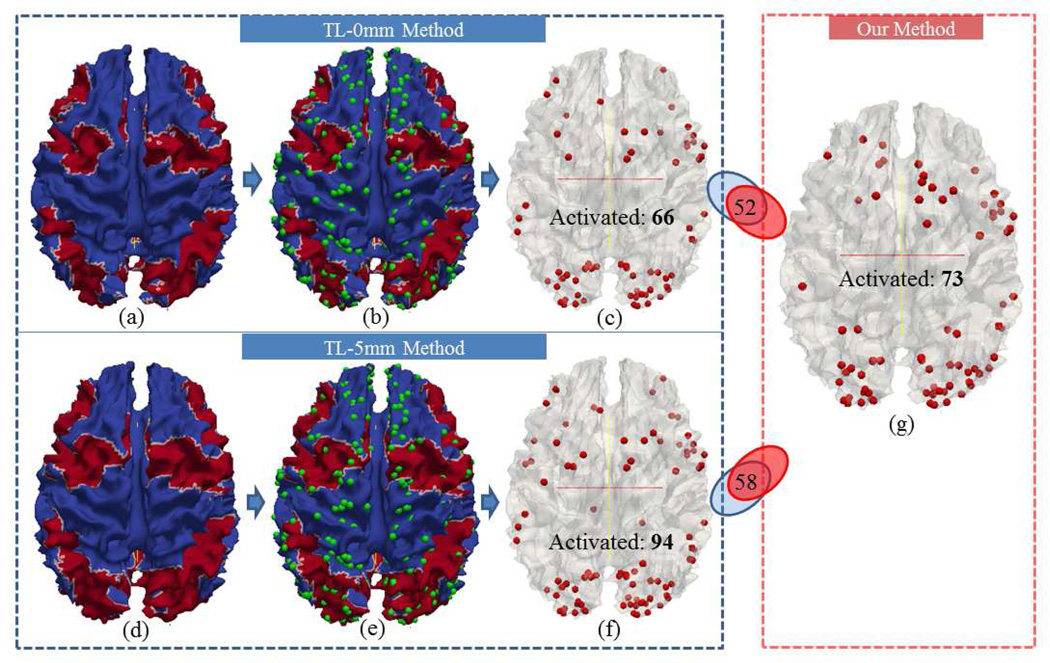
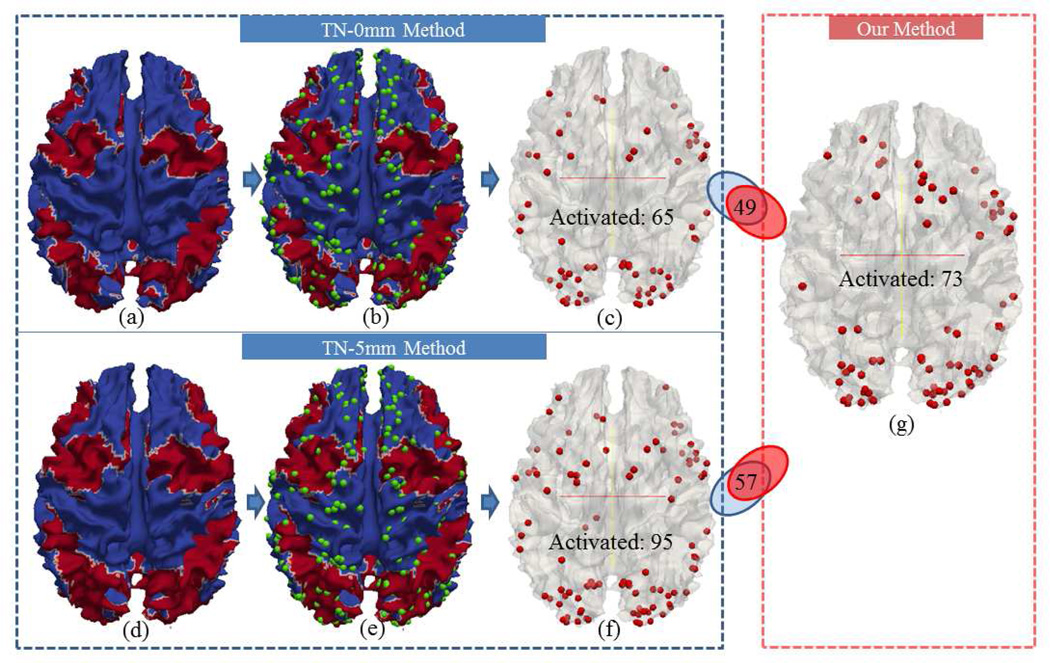
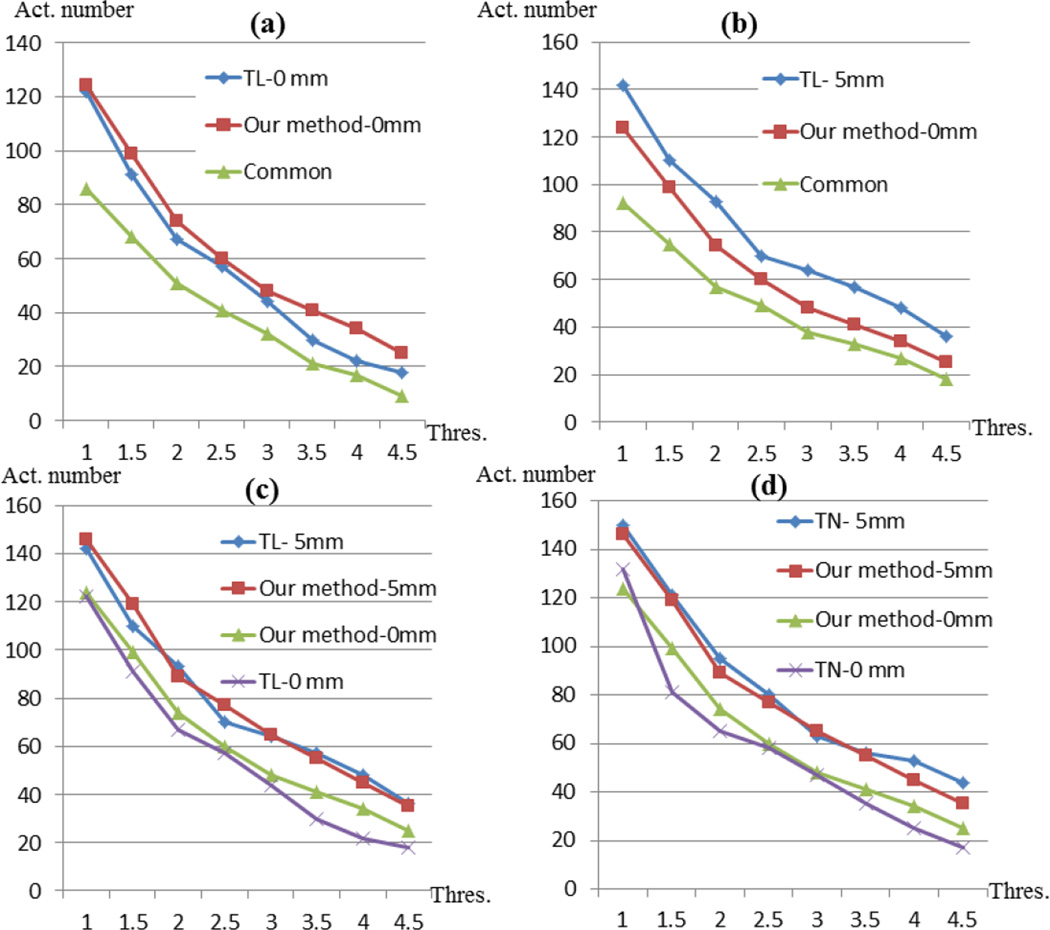
To quantitatively compare activation detection results by the traditional method (FSL FEAT/FLAME) based on image registration and our methods (Section 2.4), we co-localized the traditional group-wise activation results (Figs.16a-16f and Figs.17a-17f) with our DICCCOL-based activation detection results (Fig.16g and Fig.17g). Specifically, we carried out traditional full-level group-wise activation detection using the FSL FEAT on volumes of the same group of subjects with different spatial smoothing settings (FWHM=0mm or 5mm) and different registration methods (linear (FSL FLIRT) or non-linear (FSL FNIRT)). In the following of this paper, we use TL to represent traditional method based on linear registration, and TN to represent traditional method based on non-linear registration. Also, we use “0mm” or “5mm” to indicate different spatial smoothing settings. With the same threshold of Z>2.0 and p=0.05, the activation regions from different methods are mapped onto the cortical surfaces with red color in Fig.16a (TL-0mm), Fig.16d (TL-5mm), Fig.17a (TN-0mm) and Fig.17d (TN-5mm), respectively. The traditional method without spatial smoothing (FWHM=0mm, denoted as TL-0mm and TN-0mm) detects reasonable regions in spite of inaccuracies induced by image registration. However, with spatial smoothing of FWHM 5mm (TL-5mm and TN-5mm), the spatial resolution of activation is reduced because of false positives caused by smoothing (Mikl et al., 2008; Tahmasebi et al., 2009; Yue et al., 2010; Li et al., 2012d). For ease of comparison, we further overlaid the DICCCOL system (green spheres in Figs.16b, 16e, 17b and 17e) on the cortical surfaces, and the DICCCOLs located in the red regions are selected as activation, which are visualized in Fig.16c, Fig.16f, Fig.17c, Fig.17f. Fig.16c shows 66 activated DICCCOLs using the TL-0mm method, and the number of its common activations with the result by our method is 52, which accounts for the majority of both methods. In contrast, the activated DICCCOLs using TL-5mm method only have 58 (out of 94) in common with our method. Similar results were obtained by using non-linear registration, as shown in Fig.17. Furthermore, we performed similar comparison with different thresholds of z-score, and the activated DICCCOL numbers are plotted in Fig.18. In Fig.18a, the red curve and blue curve almost match together before the z-score threshold of 3.0. When the z-score threshold increases above 3.0, the blue curve is closer to the green curve, implying that our method has similar resolution as the TL-0mm method. However, with higher z-score threshold, the TL-0mm method will be less powerful because of false negatives caused by image registration misalignment. In contrast, our method is able to better preserve the true positives, while avoiding false negatives. In Fig.18b, the blue curve is above the red curve, and the difference between them grows larger when the z-score threshold is over 3.0. In comparison, the red curve approximates the green curve, which implies that our method has higher resolution and specification than the TL-5mm method, especially when the z-score threshold is higher. For the TL-5mm method, even using a high z-score threshold, the false positives caused by spatial smoothing cannot be effectively prevented.
Fig. 16.
Comparison of activation by our method and the traditional method based on linear registration on DICCCOL landmarks. (a-c): Activations detected using the TL-0mm method. (d-f): Activations detected using the TL-5mm method. (a) and (d): Cortical surfaces mapped with activations from the traditional method, on which the red area represents activation. (b) and (e) are (a) and (d) overlaid with DICCCOLs (green spheres). (c) and (f): Selected activated DICCCOLs when they locate in the red areas of (b) and (e). (g): Activated DICCCOLs by our method.
Fig. 17.
Comparison of activation by our method and the traditional method using non-linear registration on DICCCOL landmarks. (a-c): Activations detected using the TN-0mm method. (d-f): Activations detected using the TN-5mm method. (a) and (d): Cortical surfaces mapped with activations from the traditional method, on which the red area represents activation. (b) and (e) are (a) and (d) overlaid with DICCCOLs (green spheres). (c) and (f): Selected activated DICCCOLs when they locate in the red areas of (b) and (e). (g): Activated DICCCOLs by our method.
Fig. 18.
Comparison of activated DICCCOL numbers by our method and by the traditional method using different thresholds of z-score. T-0mm denotes the traditional method with spatial smoothing of FWHM 0mm (shown in (a)), and T-5mm is alike (shown in (b)). Our method-5mm denotes our method with spatial smoothing of FWHM 5mm (shown in (c)). The x-axis in (a)-(b) represents the threshold value of z-score and the y-axis represents activated DICCCOL numbers. The curves “common” represent the number of commonly activated DICCCOLs by both methods in (a) and (b) respectively.
For further evaluation of the statistical power of the DICCCOL based method, we applied the DICCCOL activation detection procedure to the same dataset with spatial smoothing of FWHM 5mm. With different threshold, the activated DICCCOL numbers are present with orange curve denoted with “Our method-5mm” in Fig.18c and Fig.18d. In comparison, activated DICCCOL numbers using three other methods are also curved in the same subfigures. It’s shown that based on preprocessing of spatial smoothing, the activation numbers using our method are relatively increased. The increment is obviously due to the effect of spatial smoothing, but at the same time the involved statistical inaccuracy by smoothing is evident. Note that employing the same level of spatial smoothing, our method detects similar or relatively more (with certain thresholds) quantity of activated DICCCOLs than the traditional method, which indicates that our method possesses similar or even higher statistical power than the traditional method because of the alignment of brain regions based on the optimized anatomical correspondence.
From the comparison of Fig.16 and Fig.17, we can see that with non-linear registration, similar group-wise activation is obtained and the anatomical variation problem is not significantly alleviated. Additionally, the correspondence built by non-linear registration doesn’t perform as good as our DICCCCOL system, because the intersections of activated DICCCOLs with our method in Fig.17 are as low as linear registration. Furthermore, by comparing Fig.18c and Fig.18d, we can see that our method without spatial smoothing detects more activation than traditional method, no matter the registration is established by the linear method or non-linear method.
3.5. Sensitivity and Specificity
Group-wise activation detection is a statistical assessment of individual activation maps based on the alignment of different brains and the correspondence of brain anatomy. Individual z-score maps generated from the GLM method depict the activation significance of anatomical structures, which are relatively credible reflection of individual brain function. Typically, false positives or negatives of group-wise activation could be caused by misalignment of anatomical structures. Given the lack of ground truth, in this work we use statistics of the individual z-scores on corresponding structures as pseudo ground truth to measure the sensitivity and specificity of the traditional methods and our method.
Specifically, we used a threshold of z-score>2.5 and p<0.05 to select individually activated landmarks for each subject, and then we voted activated landmarks from each subject and determined 36 group-wise activated landmarks with a dominant voting selection. Thus these 36 landmarks are regarded as pseudo ground-truth activations. Then, by using each different method (TL-0mm, TL-5mm, TN-0mm and TN-5mm), we selected 36 top activated landmarks. Based on the 36 pseudo ground-truth activations, the sensitivity and specificity of each method compared in this paper are measured by the formulas below:
The sensitivity and specificity of four traditional methods, in comparison with our method, are summarized in Table 4. From the table we can infer that our method exhibits both higher sensitivity and specificity than four traditional methods. The traditional methods have substantially lower sensitivity, which might be due to that the spatial smoothing involved false positives as discussed in Section 3.2.1 and in Figs.8–9. Therefore, our method based on DICCCOL correspondence can better avoid false positive and false negative than traditional methods.
Table 4.
Sensitivity and specificity of four traditional methods and our method.
| Methods | TL-0mm | TL-5mm | TN-0mm | TN-5mm | Our method |
|---|---|---|---|---|---|
| Sensitivity | 0.639 | 0.694 | 0.583 | 0.639 | 0.889 |
| Specificity | 0.960 | 0.966 | 0.953 | 0.960 | 0.988 |
3.6. Reproducibility analysis
One of the big challenges in real fMRI data activation detection is the lack of ground truth for evaluation. Instead, reproducibility analysis is usually employed for cross evaluation.
3.6.1 Reproducibility study within the same working memory dataset
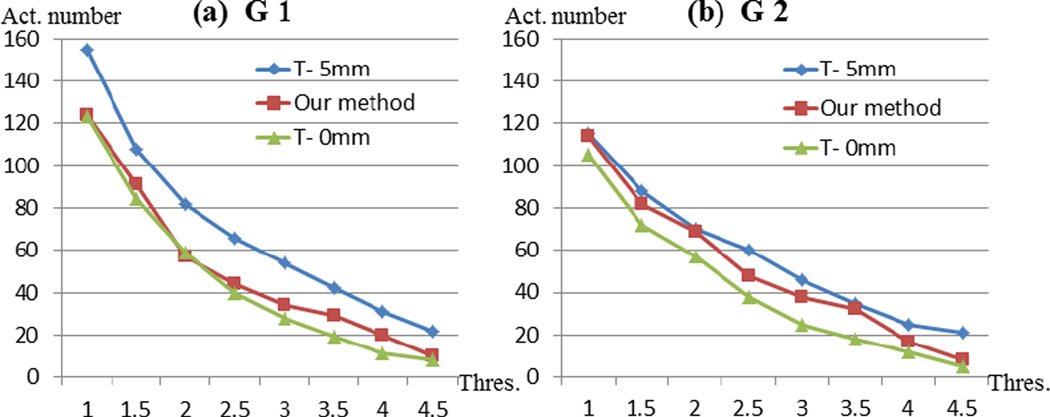
In our research, we first randomly divide the 19 subjects from data set 1 into two groups, G1 containing 10 subjects (subject #1~subject #10) and G2 containing 10 subjects (subject #10~suject #19). We applied the same procedure of our method to each group, as well as comparison experiments akin to Section 3.3. The activation spatial patterns are both quite similar as the patterns in Fig.16g. And the derived activation numbers for each group with the same series thresholds are visualized in Fig.18. Although results from the two groups are slightly different in the activation numbers for the same threshold, this variation of data sets is similarly captured by three different methods as shown in Fig.18. And our method reserves similar performance as the result in Section 3.3. As shown in Figs. 18a and 18b, the red curves using our method performs similar trend in two groups as the one in in Fig.17 for the whole data set. Comparing with traditional method with two different methods, the performance of our method is stable across different set of data.
For further evaluation of the robustness across different groups of data set, we use the Jaccard similarity coefficient to measure the similarity of activations from different groups, which is defined as:
| (3) |
where A, B are two activated DICCCOL sets from different groups. Specifically, we measure the similarity of activated DCCCOLs from three different groups: G1 (10 subjects), G2 (10 subjects) and Gall (19 subjects). Since different groups may vary in threshold selection of z-score when determining activation, we use an alternative way to select active DICCCOLs. In detail, we sort the DICCCOLs with their z-scores and select the top 36 DICCCOLs (10% of total) with high z-score and determine them as activation. So for each group, we have a set of 36 activated DICCCOLs using each method. And the Jaccard similarities are measured for activations of different groups as shown in Table 3. From the table we can infer that, our method possess dramatic cross-group similarity than T-0mm method and relatively higher cross-group similarity than T-5mm method. This result indicates that our method possesses higher cross-group stability and robustness, which is also evidence of accuracy of method.
Table 3.
Jaccard similarity of activated DICCCOL sets from different groups using three methods.
| Methods | J(G1, G2) | J(G1, Gall) | J(G2, Gall) | Average |
|---|---|---|---|---|
| Our method | 0.610 | 0.805 | 0.763 | 0.726 |
| T-5mm | 0.644 | 0.762 | 0.762 | 0.723 |
| T-0mm | 0.542 | 0.721 | 0.761 | 0.675 |
3.6.2 Reproducibility study using the HCP fMRI dataset
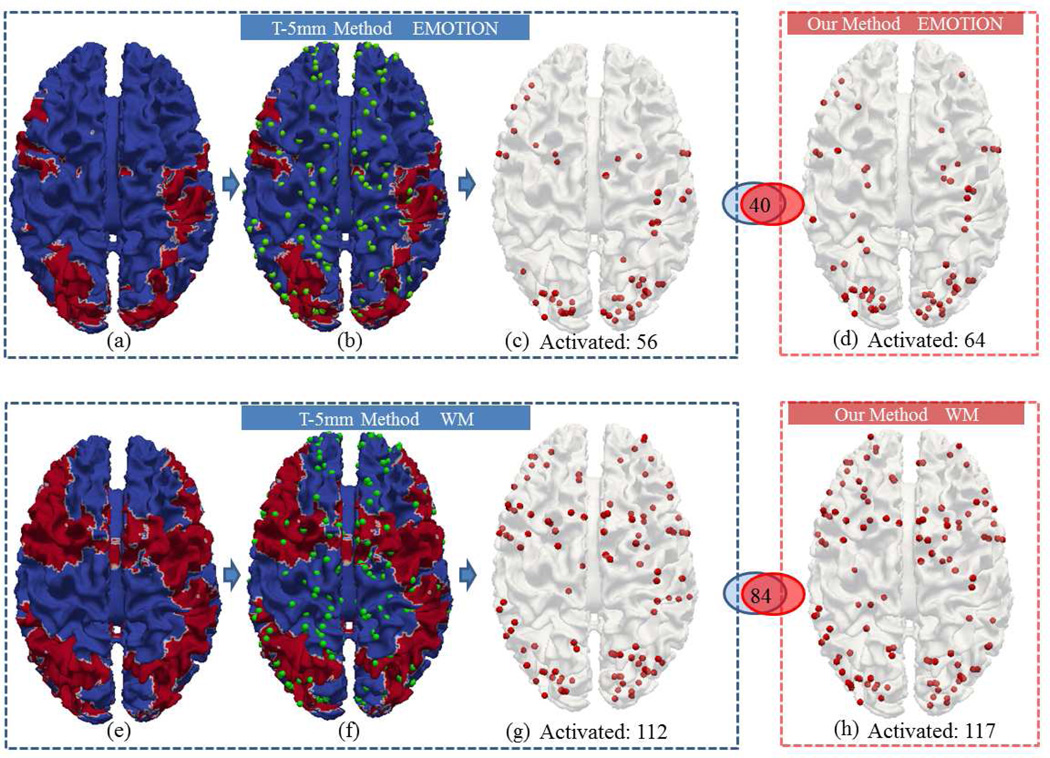
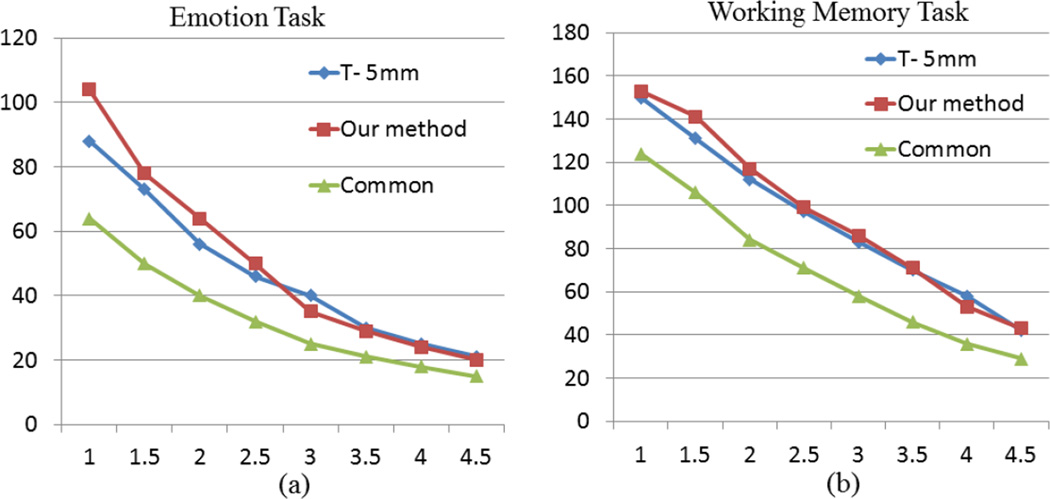
For further evaluation and validation of our method, we employed the publicly available HCP dataset as an independent data source, and our methods were applied on the emotion and working memory task fMRI datasets, respectively. Similarly, we preformed comparisons with the traditional method with spatial smoothing of 5mm in Fig.20 and Fig.21. It is noted that with the large amount of 68 HCP Q1 release subjects, our method detected substantially more activations than the T-5mm method, which is an additional evidence of the higher sensitivity of our method and the better correspondence established by DICCCOL. Similarly, the sensitivity and specificity are measured with the method in Section 3.5. From the results on two HCP task fMRI datasets in Table 5, our method exhibits reproducibly higher sensitivity and specificity than the traditional methods.
Fig. 20.
(a-c): Activations detected using the T-5mm method for the emotion task. (d): Activations detected using our method for the emotion task. (e-g) Activations detected using the T-5mm method for the working memory task. (h) Activations detected using our method for the working memory task. (a) and (e): Cortical surfaces mapped with activations from the traditional method, on which the red area represents activation. (b) and (f) are (a) and (e) overlaid with DICCCOLs (green spheres). (c) and (g): Selected activated DICCCOLs when they locate in the red areas of (b) and (f).
Fig. 21.
Comparison of activated DICCCOL numbers by our method and by the traditional method using different thresholds of z-score. T-5mm denotes the traditional method with spatial smoothing of FWHM 5mm. (a) Comparison for the emotion task. (b) Comparison for the working memory task.
Table 5.
Sensitivity and specificity of one traditional method and our method for the emotion task and working memory task in the HCP dataset.
| Emotion Task | Working Memory Task | ||||
|---|---|---|---|---|---|
| Methods | T-5mm | Our method | Methods | T-5mm | Our method |
| Sensitivity | 0.694 | 0.750 | Sensitivity | 0.667 | 0.778 |
| Specificity | 0.959 | 0.972 | Specificity | 0.963 | 0.975 |
4. DISCUSSION AND CONCLUSION
In this paper, we presented a novel, alternative group-wise fMRI activation detection framework based on the recently discovered and replicated 358 DICCCOL landmarks (Zhu et al., 2012), which provides intrinsic structural correspondences across individuals. Experimental results have demonstrated that this capacity substantially alleviates the possible misalignment resulted from the traditionally used image registration and inaccuracy caused by spatial smoothing processes. Also, the statistical power and robustness can be substantially improved by the direct pooling of results from a group of subjects via the intrinsically-established correspondences in DICCCOL landmarks. In contrast, registration-based group-wise activation detection methods have difficulty in dealing with large anatomic variations across subjects and depend heavily on the spatial smoothing, which could substantially increase the possibilities of false positives and false negatives in activation detection. Our extensive experimental results have demonstrated that the DICCCOL-based activation detection approach has better sensitivity and specificity in detecting consistently activated brain anatomical landmarks than traditional methods.
The proposed methods also have limitations and can be potentially improved in the following directions. First, it should be noted that currently, the 358 DICCCOL landmarks cannot cover the whole cerebral cortex nor detect activations at the whole-brain level. Nevertheless, the fMRI activation detection results achieved by the 358 DICCCOL landmarks already provided novel insights into how group-wise activation detection can be better performed using cortical landmarks of intrinsically-established correspondences across individuals, which is the major contribution of this work. With the improvement of the DICCCOL system in the future, we envision that the number of DICCCOL landmarks will increase substantially, and then larger portion of the cerebral cortex can be covered by the dense and consistent landmarks. Another potential way to remedy the limitation of the spatial coverage of DICCCOL system is that the 358 landmarks and their anatomical features can be used as constraints to guide more accurate non-linear cross-subject registration, based on which the whole single brains could be precisely aligned and activation detection can be better established. Second, the proposed methods should be tested and evaluated in larger scale multimodal fMRI/DTI datasets in the future. In this work, we used 19 cases of working memory task-based fMRI datasets for the methodology development and evaluation. Though this is a reasonably good number for group-wise activation detection (Thirion et al., 2007), we plan to evaluate the methods on multiple fMRI/DTI datasets such as those in Zhu et al., 2012.
FMRI activation detection has been a critical step in applying fMRI techniques in cognitive and clinical neuroscience applications. Thus, the development and validation of robust, effective and accurate approaches for fMRI activation detection have been investigated for decades (e.g., Friston et al., 1994; Heeger and Ress, 2002; Beckmann et al., 2003; Woolrich et al., 2004b; Matthews and Jezzard, 2004; Thirion et al., 2007; Logothetis et al., 2008; Ng et al., 2010). However, due to the challenges of considerable variability in brain structure and function across individuals and the lack of quantitative representation of common brain architectures, novel fMRI activation detection methods have been still in active research in the neuroimaging community. The major insight made from this work is that an individualized representation of common structural brain architectures across different brains, e.g., by the DICCCOL system (Zhu et al., 2012), can substantially improve the sensitivity and specificity of fMRI activation detection. We believe that the group-wise consistent activation patterns detected on the reproducible and common DICCCOL landmarks could provide more confidence in the neural activity information conveyed in the fMRI time series data.
Fig. 19.
Comparison of activated DICCCOL numbers detected by our method and two traditional methods in two groups of the same data set. (a) Activated DICCCOL numbers of 3 methods in Group 1. (b) Activated DICCCOL numbers of 3 methods in Group 2.
Acknowledgements
T Liu was supported by the NIH K01 EB 006878, NIH R01 HL087923-03S2, NIH R01 DA033393, and NSF CAREER Award IIS-1149260. L Guo was supported by NSFC grant #61273362. J Lv was supported by the China Government Scholarship. J. Han was supported by the National Science Foundation of China under Grant 61005018 and 91120005, NPU-FFR-JC20120237 and Program for New Century Excellent Talents in University under grant NCET-10-0079. X. Hu was supported by the National Science Foundation of China under Grant 61103061, China Postdoctoral Science Foundation under Grant 20110490174 and 2012T50819. The authors would like to thank Carlos Faraco and L. Stephen Miller for sharing their DTI/fMRI datasets. The authors would like to thank the anonymous reviewers for their constructive comments.
Footnotes
Information Sharing Statement
Source codes of the proposed computational algorithms and methods are available at: http://www.cs.uga.edu/~tliu/neuroinformatics/group-wise-activation.zip
Source codes and models of the DICCCOL system are available at: http://dicccol.cs.uga.edu. The fMRI data of emotion task and working memory task was obtained from the publicly available Human Connectome Project (HCP) data: http://www.humanconnectome.org/.
References
- Tahmasebi Amir M, Abolmaesumi Purang, Zheng Zane Z, Munhall Kevin G, Johnsrude Ingrid S. Reducing inter-subject anatomical variation: Effect of normalization method on sensitivity of functional magnetic resonance imaging data analysis in auditory cortex and the superior temporal region. NeuroImage. 2009;Volume 47(Issue 4):1, 1522–1531. doi: 10.1016/j.neuroimage.2009.05.047. [DOI] [PMC free article] [PubMed] [Google Scholar]
- Andersson J, Smith S, Jenkinson M. FNIRT - FMRIB’s Non-linear Image Registration Tool; 14th Annual Meeting of the Organisation for Human Brain Mapping; 2008. p. 496. [Google Scholar]
- Ardekani BA, Bachman AH, Strother SC, Fujibayashi Y, Yonekur Y. Impact of intersubject image registration on group analysis of fMRI data. International Congress Series. 2004;1265(0):49–59. [Google Scholar]
- Asman AJ, Landman BA. Characterizing spatially varying performance to improve multiatlas multi-label segmentation. IPMI. 2011;6801:85–96. doi: 10.1007/978-3-642-22092-0_8. [DOI] [PMC free article] [PubMed] [Google Scholar]
- Avants BB, Epstein CL, Grossman M, Gee JC. Symmetric diffeomorphic image registration with cross-correlation: evaluating automated labeling of elderly and neurodegenerative brain. Medical Image Analysis. 2008;12:26–41. doi: 10.1016/j.media.2007.06.004. [DOI] [PMC free article] [PubMed] [Google Scholar]
- Barch DM, Burgess GC, Harms MP, et al. Function in the Human Connectome: Task-fMRI and Individual Differences in Behavior. NeuroImage. 2013 doi: 10.1016/j.neuroimage.2013.05.033. [DOI] [PMC free article] [PubMed] [Google Scholar]
- Beckmann CF, Jenkinson M, Smith SM. General multi-level linear modelling for group analysis in FMRI. NeuroImage. 2003;20:1052–1063. doi: 10.1016/S1053-8119(03)00435-X. [DOI] [PubMed] [Google Scholar]
- Bowman DF, Caffo B, Bassett SS, Kilts C. Bayesian hierarchical framework for spatial modeling of fmri data. NeuroImage. 2008;39:146–156. doi: 10.1016/j.neuroimage.2007.08.012. [DOI] [PMC free article] [PubMed] [Google Scholar]
- Bullmore E, Brammer M, Williams S, Rabe-Hesketh S, Janot N, David A, Mellers J, Howard R, Sham P. Statistical methods of estimation and inference for functional MR image analysis. Magn. Reson. Med. 1996;35(2):261–277. doi: 10.1002/mrm.1910350219. [DOI] [PubMed] [Google Scholar]
- Calhoun VD, Liu J, Adali T. A review of group ICA for fMRI data and ICA for joint inference of imaging, genetic, and ERP data. Neuroimage. 2009;45(1, Supplement 1):S163–S172. doi: 10.1016/j.neuroimage.2008.10.057. [DOI] [PMC free article] [PubMed] [Google Scholar]
- Costafreda SG. Pooling fMRI data: meta-analysis, mega-analysis and multi-center studies. Front, Neuroinformatics: 2009;3:33. doi: 10.3389/neuro.11.033.2009. [DOI] [PMC free article] [PubMed] [Google Scholar]
- Cronbach LJ. Coefficient alpha and the internal structure of tests. Psychometrika. 1951;16(3):297–334. [Google Scholar]
- Derrfuss J, Mar RA. Lost in localization: The need for a universal coordinate database. NeuroImage. 2009;48(1):1–7. doi: 10.1016/j.neuroimage.2009.01.053. [DOI] [PubMed] [Google Scholar]
- Everitt BS, Bullmore ET. Mixture model mapping of brain activation in functional magnetic resonance images. Human brain mapping. 1999;7(1):1–14. doi: 10.1002/(SICI)1097-0193(1999)7:1<1::AID-HBM1>3.0.CO;2-H. [DOI] [PMC free article] [PubMed] [Google Scholar]
- Faraco CC, Unsworth N, Langley J, Terry D, Li K, Zhang D, Liu T, Miller LS. Complex span tasks and hippocampal recruitment during working memory. NeuroImage. 2011;55(2):773–787. doi: 10.1016/j.neuroimage.2010.12.033. [DOI] [PubMed] [Google Scholar]
- Friston KJ, Holmes AP, Worsley KJ, Poline J-P, Frith CD, Frackowiak RSJ. Statistical parametric maps in functional imaging: a general linear approach. Human brain mapping. 1994;2(4):189–210. [Google Scholar]
- Friston KJ, Holmes A, Poline JB, Price CJ, Frith CD. Detecting activations in PET and fMRI: levels of inference and power. Neuroimage. 1996;4(3 Pt 1):223–235. doi: 10.1006/nimg.1996.0074. [DOI] [PubMed] [Google Scholar]
- Ge B, Guo L, Zhang T, Hu X, Han J, Liu T. Resting state fMRI-guided fiber clustering. MICCAI. 2011;14(Pt 2):149–156. doi: 10.1007/978-3-642-23629-7_19. [DOI] [PubMed] [Google Scholar]
- Hamilton AF. Lost in localization: A minimal middle way. Neuroimage. 2009;48:8–10. doi: 10.1016/j.neuroimage.2009.05.007. [DOI] [PubMed] [Google Scholar]
- Heeger DJ, Ress D. What does fMRI tell us about neuronal activity? Nat. Rev. Neurosci. 2002;3(no. 2):142–151. doi: 10.1038/nrn730. [DOI] [PubMed] [Google Scholar]
- Derrfuss J, Mar RA. Lost in localization: the need for a universal coordinate database. NeuroImage. 2009;48(1):1–7. doi: 10.1016/j.neuroimage.2009.01.053. [DOI] [PubMed] [Google Scholar]
- Jia H, Wu G, Wang Q, Shen D. ABSORB: atlas building by self-organized registration and bundling. NeuroImage. 2010;51(3):1057–1070. doi: 10.1016/j.neuroimage.2010.03.010. [DOI] [PMC free article] [PubMed] [Google Scholar]
- Kang J, Johnson TD, Nichols TE, Wager TD. Meta analysis of functional neuroimaging data via Bayesian spatial point processes. Journal of the American Statistical Association. 2011;106(493):124–134. doi: 10.1198/jasa.2011.ap09735. [DOI] [PMC free article] [PubMed] [Google Scholar]
- Kim S, Smyth P, Stern H. A Bayesian mixture approach to modeling spatial activation patterns in multisite fMRI data. Medical Imaging, IEEE Transactions on. 2010;29(6):1260–1274. doi: 10.1109/TMI.2010.2044045. [DOI] [PMC free article] [PubMed] [Google Scholar]
- Laird AR, Eickhoff SB, Kurth F, Fox PM, Uecker AM, Turner JA, Robinson JL, Lancaster JL, Fox PT. ALE meta-analysis workflows via the BrainMap database: Progress towards a probabilistic functional brain atlas. Neuroinformatics. 2009;3(23):11. doi: 10.3389/neuro.11.023.2009. [DOI] [PMC free article] [PubMed] [Google Scholar]
- Li K, Guo L, Zhu D, Hu X, Han J, Liu T. Neural Information Processing Systems (NIPS) 2010. Individualized ROI Optimization via Maximization of Group-wise Consistency of Structural and Functional Profiles. [DOI] [PMC free article] [PubMed] [Google Scholar]
- Li K, Guo L, Li G, Nie J, Faraco C, Zhao Q, Miller S, Liu T. Cortical surface based identification of brain networks using high spatial resolution resting state fMRI data. International Symposium of Biomedical Imaging (ISBI) 2010:656–659. [Google Scholar]
- Li K, Guo L, Li G, Nie J, Faraco C, Cui G, Zhao Q, Miller S, Liu T. Gyral folding pattern analysis via surface profiling. NeuroImage. 2010;52(4):1202–1214. doi: 10.1016/j.neuroimage.2010.04.263. [DOI] [PMC free article] [PubMed] [Google Scholar]
- Li Y, Zhu H, Shen D, Lin W, Gilmore JH, Ibrahim JG. Multiscale adaptive regression models for neuroimaging data. Journal of the Royal Statistical Society. Series B: Statistical Methodology. 2011;73(4):559–578. doi: 10.1111/j.1467-9868.2010.00767.x. [DOI] [PMC free article] [PubMed] [Google Scholar]
- Li K, Zhu D, Guo L, Li Z, Lynch ME, Coles C, Hu X, Liu T. Connectomics signatures of prenatal cocaine exposure affected adolescent brains. Hum. Brain Mapp. 2012 doi: 10.1002/hbm.22082. In press. [DOI] [PMC free article] [PubMed] [Google Scholar]
- Li K, Guo L, Faraco C, Zhu D, Chen H, Yuan Y, Lv J, Deng F, Jiang X, Zhang T, Hu X, Zhang D, Miller L, Liu T. Visual Analytics of Brain Networks . NeuroImage. 2012 doi: 10.1016/j.neuroimage.2012.02.075. in press. [DOI] [PMC free article] [PubMed] [Google Scholar]
- Li K, Guo L, Zhu D, Hu X, Han J, Liu T. Individual Functional ROI Optimization Via Maximization of Group-Wise Consistency of Structural and Functional Profiles. Neuroinformatics. 2012:1–18. doi: 10.1007/s12021-012-9142-5. [DOI] [PMC free article] [PubMed] [Google Scholar]
- Li Y, Gilmore JH, Wang J, Styner M, Lin W, Zhu H. TwinMARM: two-stage multiscale adaptive regression methods for twin neuroimaging data. IEEE Trans Med Imaging. 2012;31(5):1100–1112. doi: 10.1109/TMI.2012.2185830. [DOI] [PMC free article] [PubMed] [Google Scholar]
- Li Y, Gilmore JH, Shen D, Styner M, Lin W, Zhu H. Multiscale adaptive generalized estimating equations for longitudinal neuroimaging data. NeuroImage. 2013;72:91–105. doi: 10.1016/j.neuroimage.2013.01.034. [DOI] [PMC free article] [PubMed] [Google Scholar]
- Liu T, Li H, Wong K, Tarokh A, Guo L, Wong ST. Brain tissue segmentation based on DTI data. NeuroImage. 2007;38(no. 1):114–123. doi: 10.1016/j.neuroimage.2007.07.002. [DOI] [PMC free article] [PubMed] [Google Scholar]
- Lv J, Guo L, Hu X, Zhang T, Li K, Zhang D, Yang J, Liu T. Fiber-Centered Analysis of Brain Connectivities Using DTI and Resting State FMRI Data. Medical Image Computing and Computer-Assisted Intervention – MICCAI 2010. 2010:143–150. doi: 10.1007/978-3-642-15745-5_18. [DOI] [PubMed] [Google Scholar]
- Logothetis NK. What we can do and what we cannot do with fMRI. Nature. 2008;453:869–878. doi: 10.1038/nature06976. [DOI] [PubMed] [Google Scholar]
- Matthews P, Jezzard P. Functional magnetic resonance imaging. J Neurol Neurosurg Psychiatry. 2004;75(1):6–12. [PMC free article] [PubMed] [Google Scholar]
- Mikl M, Marecek R, Hlustík P, Pavlicová M, Drastich A, Chlebus P, Brázdil M, Krupa P. Effects of spatial smoothing on fMRI group inferences. Magn Reson Imaging. 2008;26(4):490–503. doi: 10.1016/j.mri.2007.08.006. [DOI] [PubMed] [Google Scholar]
- Ng B, Abugharbieh R, Hamarneh G. Group MRF for fMRI Activation Detection; Proc CVPR; 2010. pp. 2887–2894. [Google Scholar]
- Ng B, Hamarneh G, Abugharbieh R. Modeling Brain Activation in fMRI Using Group MRF. IEEE Transactions on Medical Imaging (IEEE TMI) 2012;31(5):1113–1123. doi: 10.1109/TMI.2012.2185943. [DOI] [PubMed] [Google Scholar]
- Passingham RE, Stephan KE, Kötter R. The anatomical basis of functional localization in the cortex. Nat Rev Neurosci. 2002;3(8):606–616. doi: 10.1038/nrn893. [DOI] [PubMed] [Google Scholar]
- Shen D, Davatzikos C. HAMMER: hierarchical attribute matching mechanism for elastic registration. IEEE Transaction on Medical Imaging. 2002;21(11):1421–1439. doi: 10.1109/TMI.2002.803111. [DOI] [PubMed] [Google Scholar]
- Smith SM, Jenkinson M, Woolrich MW, Beckmann CF, Behrens TE, Johansen-Berg H, Bannister PR, De Luca M, Drobnjak I, Flitney DE, Niazy RK, Saunders J, Vickers J, Zhang Y, De Stefano N, Brady JM, Matthews PM. Advances in functional and structural MR image analysis and implementation as FSL. Neuroimage. 2004;23:S208–S219. doi: 10.1016/j.neuroimage.2004.07.051. [DOI] [PubMed] [Google Scholar]
- Smith SM, Beckmann CF, Ramnani N, Woolrich MW, Bannister PR, Jenkinson M, Matthews PM, McGonigle DJ. Variability in fMRI: a re-examination of inter-session differences. Hum. Brain Mapp. 2005;24(3):248–257. doi: 10.1002/hbm.20080. [DOI] [PMC free article] [PubMed] [Google Scholar]
- Stiers P, Peeters R, Lagae L, Hecke PV, Sunaert S. Mapping multiple visual areas in the human brain with a short fMRI sequence. NeuroImage. 2006;29(1):74–89. doi: 10.1016/j.neuroimage.2005.07.033. [DOI] [PubMed] [Google Scholar]
- Tahmasebi A. Quantification of Inter-subject Variability in Human Brain and Its Impact on Analysis of fMRI Data, PhD thesis. Queen's University; 2010. [Google Scholar]
- Thirion B, Flandin G, Pinel P, Roche A, Ciuciu P, Poline J-B. Dealing with the shortcomings of spatial normalization: Multisubject parcellation of fMRI datasets. Hum. Brain Mapp. 2006;27(8):678–693. doi: 10.1002/hbm.20210. [DOI] [PMC free article] [PubMed] [Google Scholar]
- Thirion B, Pinel P, Mériaux S, Roche A, Dehaene S, Poline JB. Analysis of a large fMRI cohort: Statistical and methodological issues for group analyses. NeuroImage. 2007;35:105–120. doi: 10.1016/j.neuroimage.2006.11.054. [DOI] [PubMed] [Google Scholar]
- Worsley KJ. An overview and some new developments in the statistical analysis of PET and fMRI data. Hum Brain Mapp. 1997;5(4):254–258. doi: 10.1002/(SICI)1097-0193(1997)5:4<254::AID-HBM9>3.0.CO;2-2. [DOI] [PubMed] [Google Scholar]
- Worsley K, Friston K. Analysis of fMRI time series revisited Again. NeuroImage. 1995;2:173–181. doi: 10.1006/nimg.1995.1023. [DOI] [PubMed] [Google Scholar]
- Woolrich M, Ripley B, Brady J, Smith S. Temporal autocorrelation in univariate linear modelling of FMRI data. NeuroImage. 2001;14(6):1370–1386. doi: 10.1006/nimg.2001.0931. [DOI] [PubMed] [Google Scholar]
- Woolrich MW, Ripley BD, Brady JM, Smith SM. Temporal autocorrelation in univariate linear modelling of FMRI data. NeuroImage. 2001;14(6):1370–1386. doi: 10.1006/nimg.2001.0931. [DOI] [PubMed] [Google Scholar]
- Woolrich MW, Jenkinson M, Brady JM, Smith SM. Fully bayesian spatio-temporal modeling of fmri data. IEEE Trans. Med. Imag. 2004;23(no. 2):213–231. doi: 10.1109/TMI.2003.823065. [DOI] [PubMed] [Google Scholar]
- Woolrich MW, Behrens TE, Beckmann CF, Jenkinson M, Smith SM. Multilevel linear modelling for FMRI group analysis using Bayesian inference. NeuroImage. 2004;Volume 21(Issue 4):1732–1747. doi: 10.1016/j.neuroimage.2003.12.023. [DOI] [PubMed] [Google Scholar]
- Xu L, Johnson TD, Nichols TE, Nee DE. Modeling Inter-Subject Variability in fMRI Activation Location: A Bayesian Hierarchical Spatial Model. Biometrics. 2009;65(4):1041–1051. doi: 10.1111/j.1541-0420.2008.01190.x. [DOI] [PMC free article] [PubMed] [Google Scholar]
- Yap PT, Gilmore JH, Lin W, Shen D. POPTRACT: population-based tractography. IEEE Transaction on Medical Imaging. 2011;30:1829–1840. doi: 10.1109/TMI.2011.2154385. [DOI] [PMC free article] [PubMed] [Google Scholar]
- Yue Y, Loh J, Lindquist MA. Adaptive spatial smoothing of fMRI images. Statistics and Its Interface. 2010;Volume 3:3–13. [Google Scholar]
- Zhang P, Cootes FT. Automatic part selection for groupwise registration. IPMI. 2011;6801:85–96. doi: 10.1007/978-3-642-22092-0_52. [DOI] [PubMed] [Google Scholar]
- Zhu D, Li K, Faraco CC, Deng F, Zhang D, Guo L, Miller LS, Liu T. Optimization of functional brain ROIs via maximization of consistency of structural connectivity profiles. NeuroImage. 2011;59(2):1382–1393. doi: 10.1016/j.neuroimage.2011.08.037. [DOI] [PMC free article] [PubMed] [Google Scholar]
- Zhu D, Li K, Guo L, Jiang X, Zhang T, Zhang D, Chen H, Deng F, Faraco C, Jin C, Wee CY, Yuan Y, Lv P, Yin Y, Hu X, Duan L, Hu X, Han J, Wang L, Shen D, Miler LS, Li L, Liu T. DICCCOL: Dense Individualized and Common Connectivity-Based Cortical Landmarks. Cerebral Cortex; 2012. In press. [DOI] [PMC free article] [PubMed] [Google Scholar]


