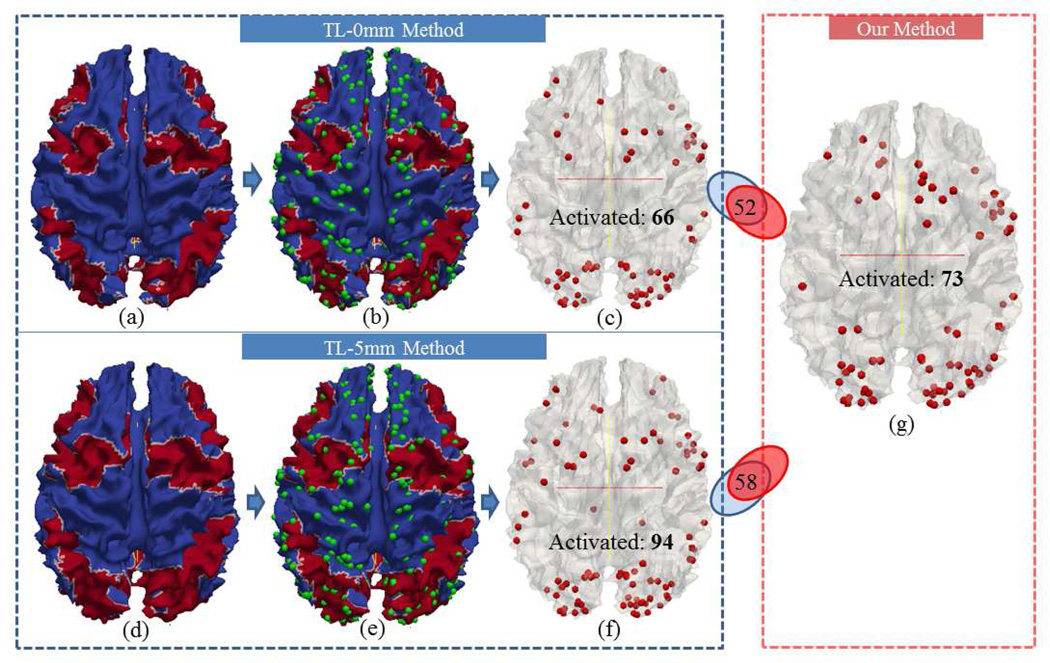
Fig. 16.
Comparison of activation by our method and the traditional method based on linear registration on DICCCOL landmarks. (a-c): Activations detected using the TL-0mm method. (d-f): Activations detected using the TL-5mm method. (a) and (d): Cortical surfaces mapped with activations from the traditional method, on which the red area represents activation. (b) and (e) are (a) and (d) overlaid with DICCCOLs (green spheres). (c) and (f): Selected activated DICCCOLs when they locate in the red areas of (b) and (e). (g): Activated DICCCOLs by our method.

