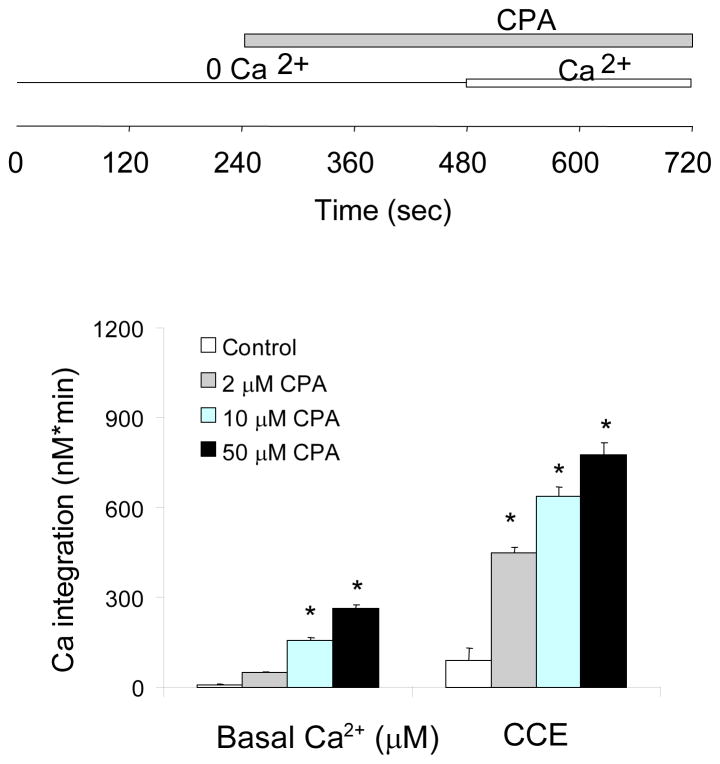
Figure 1. Characterization of CPA activated CCE.
Typical temporal profiles of the CCE are shown in subsequent figures. Fibroblasts were loaded with Fura 2AM (2 μM) for 60 min. After loading, the media were changed to calcium free BSS, and 3 min later the calcium measurements were initiated. CPA (0, 2, 10, 50 μM) was added 4 min after basal [Ca2+]i measurement, and after an additional 4 min CaCl2 (2.5 mM) was added. The top panel shows experimental paradigms. The bottom panel shows the integrations of the [Ca2+]i peak over the 3 min interval after CPA (255–480 sec) and after calcium addition (495–720 sec). Data are means ± SEM (n=51–62 cells). Asterisks indicate values vary significantly (p<0.05) from the control group by ANOVA followed by Student Newman Keul’s test.

