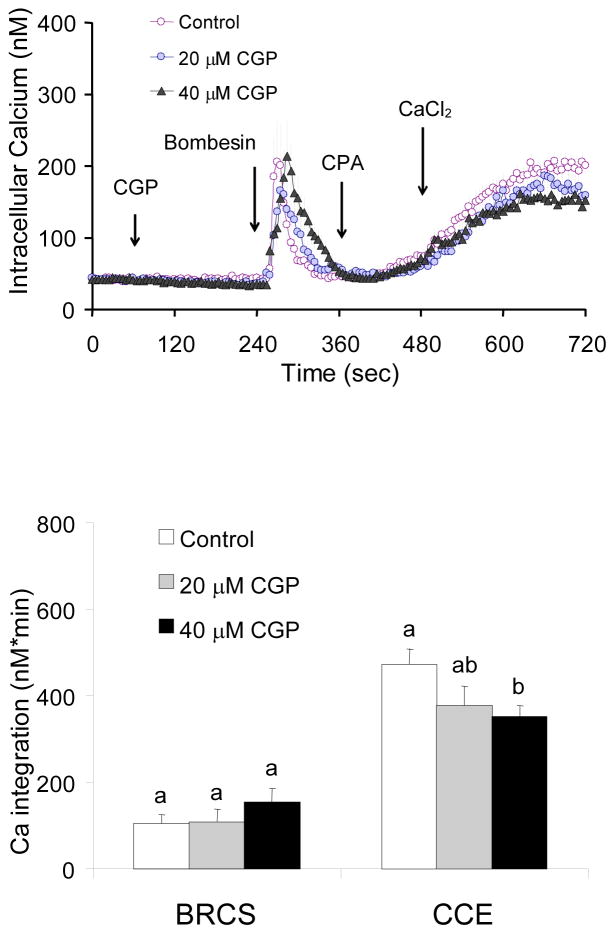
Figure 7. In the presence of InsP3, blockade of mitochondrial Ca2+ release had no effect on BRCS but impaired CCE.
Fibroblasts were loaded with Fura 2AM for 60 min. After loading, the media were changed to calcium free BSS, and 3 min later the calcium measurements were initiated. The CGP37157 (0, 20, 40 μM) was added after 1 min of basal [Ca2+]i measurements, and bombesin (2 μM) was added after 3 min. After an additional 3 min, CPA (4 μM) was added, and 3 min later CaCl2 (final concentration of 2.5 mM) was added. The top panel shows the tracings taken from 49–66 cells. The bottom panel shows the integrations of the [Ca2+]i peak over the 2–3 min interval after bombesin (255–480 sec) or calcium addition (495–720 sec). Data are means ± SEM (n = 49–66 cells). Different letters indicate values vary significantly (p<0.05) from the other groups by ANOVA followed by Student Newman Keul’s test.

