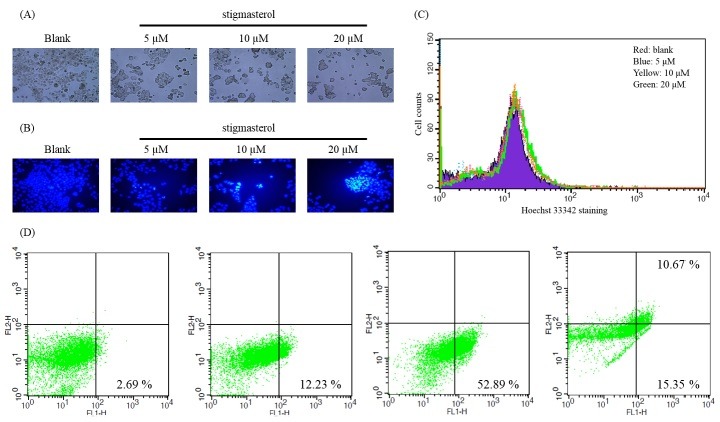
Fig. 2. (A) Morphological changes of stigmasterol treated HepG2 cells. For observation of morphological changes, cultured HepG2 cells were treated with stigmasterol for 24 h and morphological changes were detected under a light microscope (viewed at magnification of 100×). (B) Fluorescence micrographs showing the stigmasterol induced DNA damage. Stigmasterol treated cells were stained with Hoechst 33342 dye and detected under fluorescence microscope (viewed at magnification of 400×). The blue fluorescence in the nucleus indicates DNA fragmentation. (C) Cell numbers were counted using FACS after Hoechst 33342 staining. (Red; blank, Blue; 5 μM, Yellow; 10 μM, Green; 20 μM) (D) Flow cytometric analysis of the effect of stigmasterol in HepG2 cells experimented using Annexin V-PI staining assay.