Fig. 3.
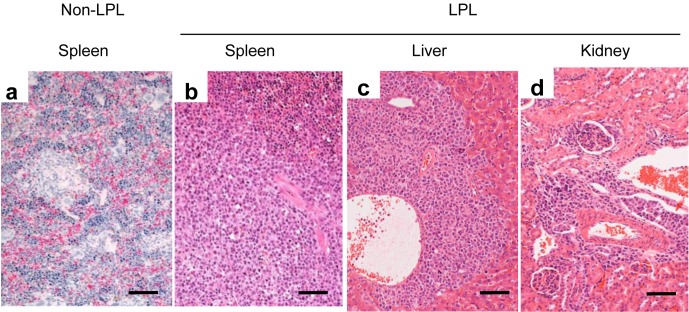
The systemic distribution of the LPL in NOG mice. An LPL completely replacing the spleen structure (b) compared with a non-affected spleen (a) is shown. An LPL is also seen in the Glisson’s sheath of the liver and in the perivascular area in the cortex of the kidney. Bar=50 µm. Hematoxylin and eosin stain.

