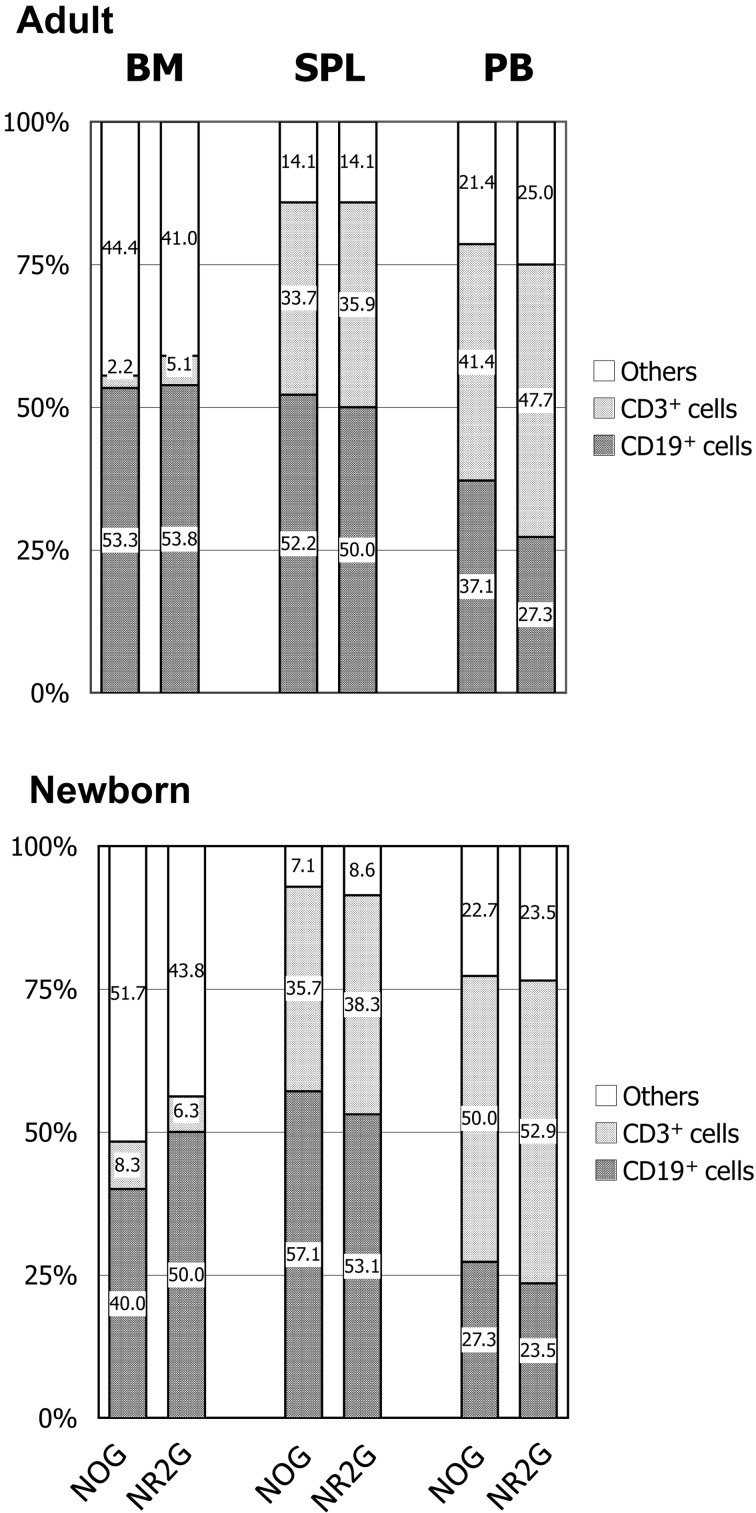
Fig. 4.
Human T and B cells in the BM, spleen and PB of HSC-transplanted mice at 20 weeks after HSC transplantation. Figures in the column represent the percentage of each cell type among human CD45+ cells. The number of NOG and NR2G mice used in this figure was 7 and 10 in adult, and 6 and 5 in newborn, respectively.

