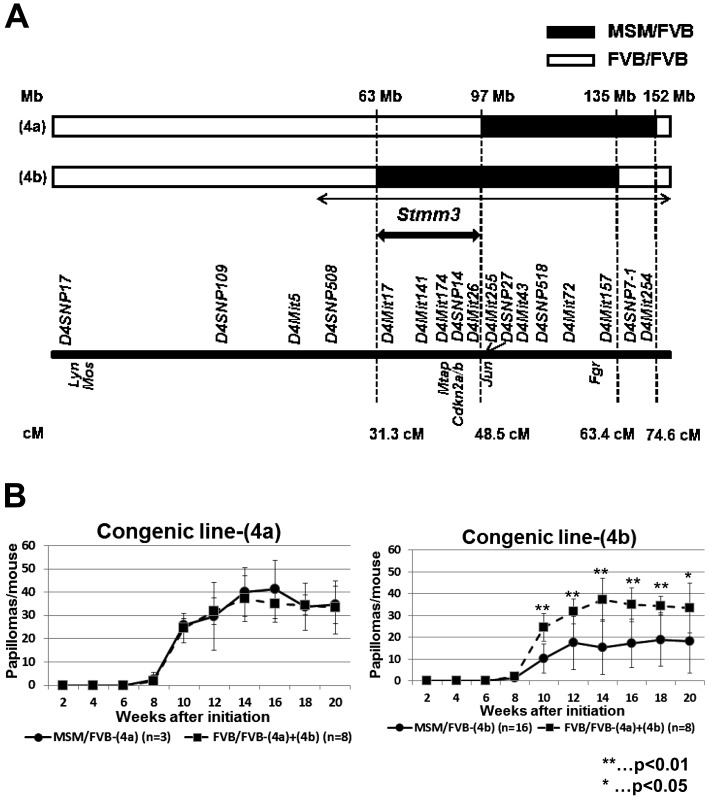
Fig. 1.
Genetic linkage map and papilloma incidence in congenic lines (4a) and (4b) on mouse chromosome 4. (A) A significant linkage peak, Stmm3 was mapped in the previous report [16]. Mouse chromosome 4 is shown horizontally. The black arrowed line indicates previously mapped Stmm3 region by QTL analysis. The bold black arrowed line indicates Stmm3 region refined by congenic mapping. Two black and white bars represents two congenic lines (4a) and (4b). The black bars indicate the heterozygous M/F region, while the white bars indicate the homozygous F/F region. Several well-known genes located on chromosome 4 are indicated with genetic markers. Genetic positions shown are according to the Ensembl database (http://uswest.ensembl.org/index.html), the Mouse Genome Informatics Database (http://www.informatics.jax.org/). (B) Comparison of average papilloma numbers/mouse between a congenic line (4a) and (4b). The panel on the left shows papilloma incidence in a congenic line (4a). The panel on the right shows papilloma incidence in a congenic line (4b). The black lines represent papilloma numbers of M/F heterozygous congenic mice. The dotted lines represent those of F/F heterozygous congenic mice.

