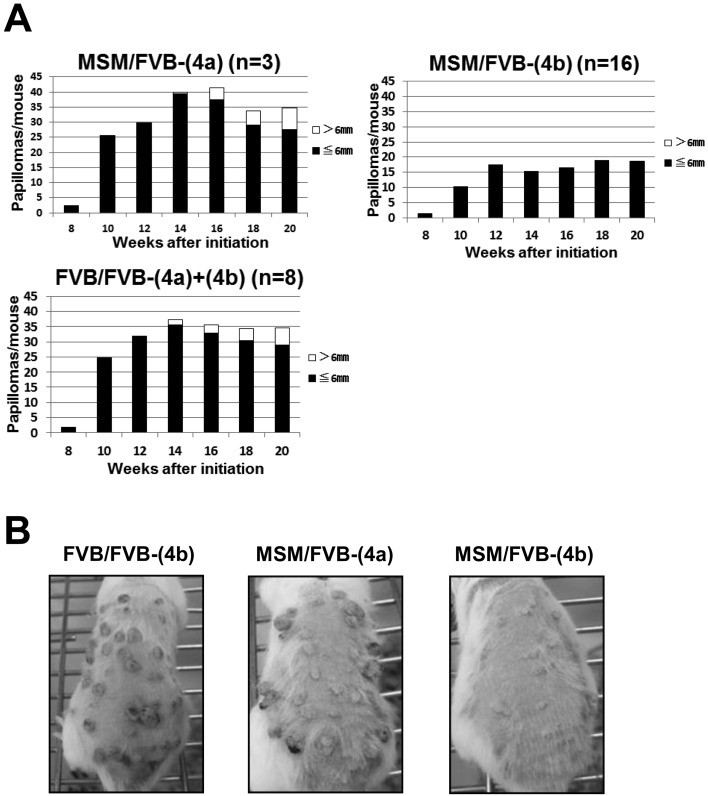
Fig. 2.
The effect of Stmm3 on papilloma growth. (A) Papilloma incidence of congenic lines (4a) and (4b) sorted according to size. The Black bars represent the number of papillomas ≤ 6 mm. The white bars represent the number of papillomas > 6 mm in diameter. (C) Photos of representative mice on TPA treatment. Dorsal back skin of a homozygous F/F mouse of a congenic line (4b), M/F heterozygous mice of congenic lines (4a) and (4b) at 20 weeks after initiation from left to right.

