Fig. 3.
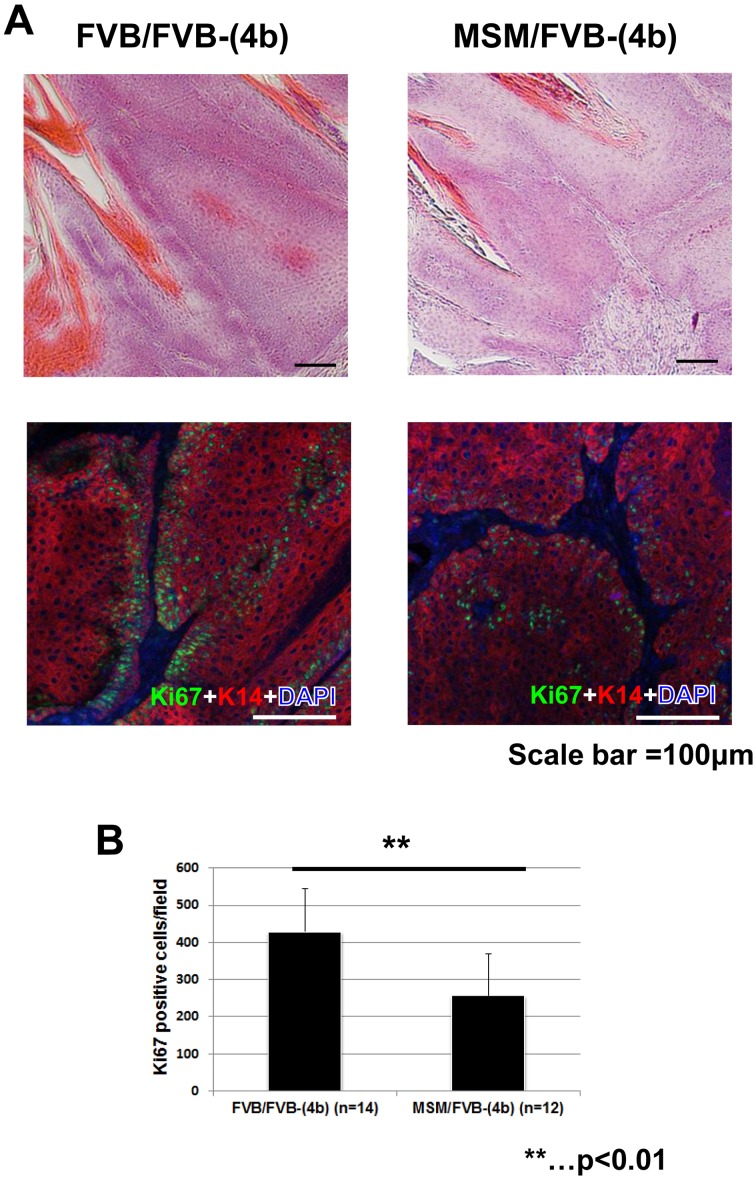
Stmm3 congenic mice show a decrease of proliferative cells in papillomas. (A) Histological analysis of papillomas from congenic mice. HE staining patterns of papillomas from F/F homozygous (left) and M/F heterozygous mice (right) of a congenic line (4b) are shown on the top. Double-immunostaining patterns of Ki67 (green) and Keratin 14 (K14) (red) in papillomas from F/F homozygous (left) and M/F heterozygous (right) mice of a congenic line (4b) are shown on the bottom. (B) The number of Ki67 positive cells in papillomas. The black bars represent the number of Ki67 positive cells in papillomas from F/F homozygous (left) and M/F heterozygous (right) mice of a congenic line (4b). The P-value was calculated for Ki67 positive cell number by t-test. Error bar represents standard deviation (S.D.). Scale bars;100 µm.

