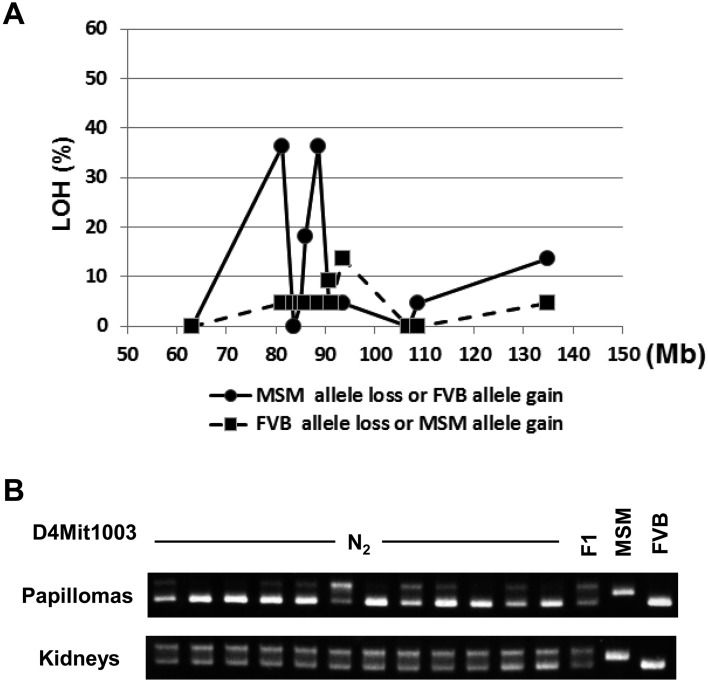
Fig. 4.
Allelic imbalance analysis of Stmm3 region on chromosome 4. (A) Frequency of allelic imbalance detected by SSLP (Simple Sequence Length Polymorphisms) analysis on distal chromosome 4. Data are derived from papillomas of N2 and N10 congenic mice (N2, n=12; N10, n=10). The percentages of chromosome imbalances are plotted for different microsatellite markers (for detailed information, see Supplementary Table 2). The black line represents MSM allele loss or FVB allele gain. The dotted line represents FVB allele loss or MSM allele gain. (B) SSLP analysis results for a representative microsatellite marker, D4Mit1003 of normal genomic (kidney) DNA and of DNA from twelve independent papillomas from different N2 mice. The upper bands represent the MSM allele, whereas the lower band represents the FVB allele.

