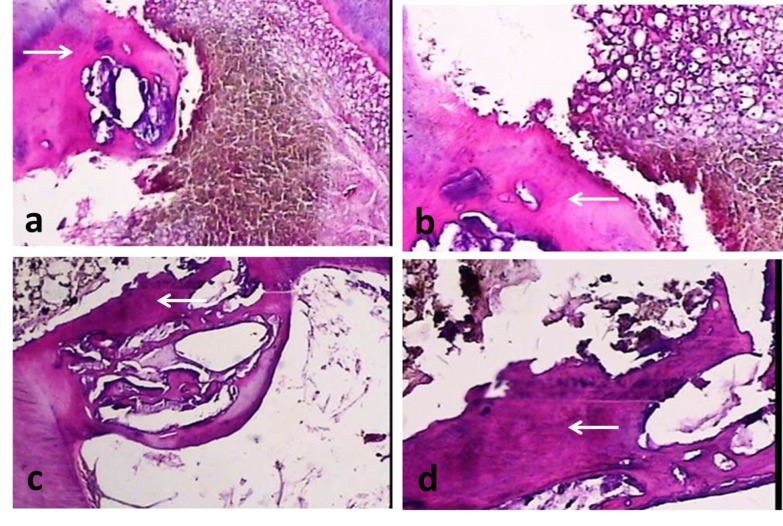
Figure 2.
Histological images of calcified tissue formation (H&E staining technique). (a) Osteoid formation (white arrow) in the vicinity of white PC, original magnification, ×40. (b) Osteoid formation (white arrow) in the vicinity of gray PC, original magnification, ×100. (c) Dentinoid formation (white arrow) in the vicinity of white MTA, original magnification, ×40. (d) Dentinoid formation (white arrow) in the vicinity of gray MTA, original magnification, ×100.

