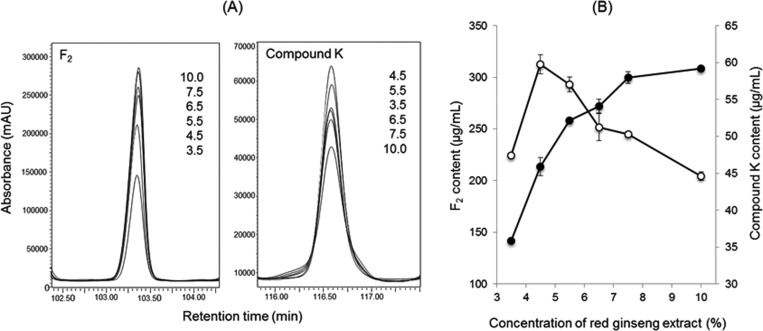
Fig. 5.
The effect of red ginseng extract concentration on the production of ginsenoside F2 and compound K. A, Enlarged HPLC chromatogram of F2 and compound K. The numbers in the figure indicate the concentration of red ginseng extract (%, w/v); B, Effect of red ginseng extract on the production of F2 and compound K. The closed and open symbols represent the concentration of F2 and compound K, respectively.

