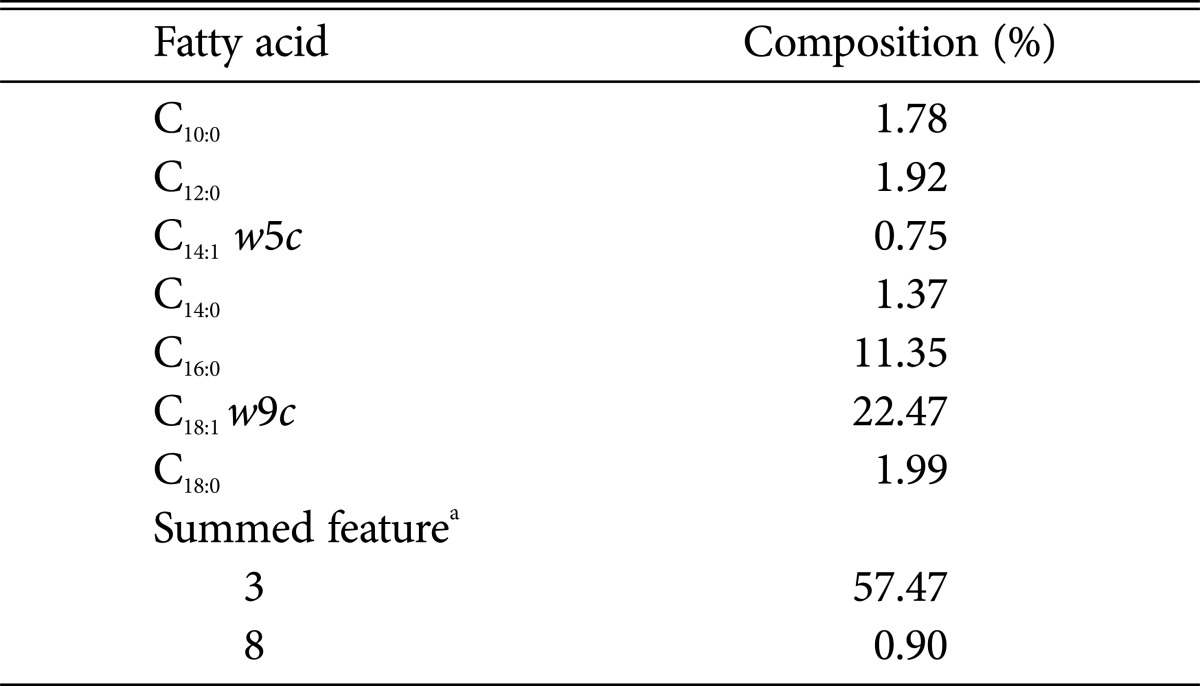
Table 1.
Cellular fatty acid composition (%) of Saccharomyces cerevisiae HJ-014

aSummed features represent groups of two or more fatty acids that could not be separated using the MIDI system. Summed feature 3 comprised C16:1 w7c/C16:1 w6c and/or C16:1 w6c/C16:1 w7c and summed feature 8 comprised C18:1 w7c and/or C18:1 w6c.
