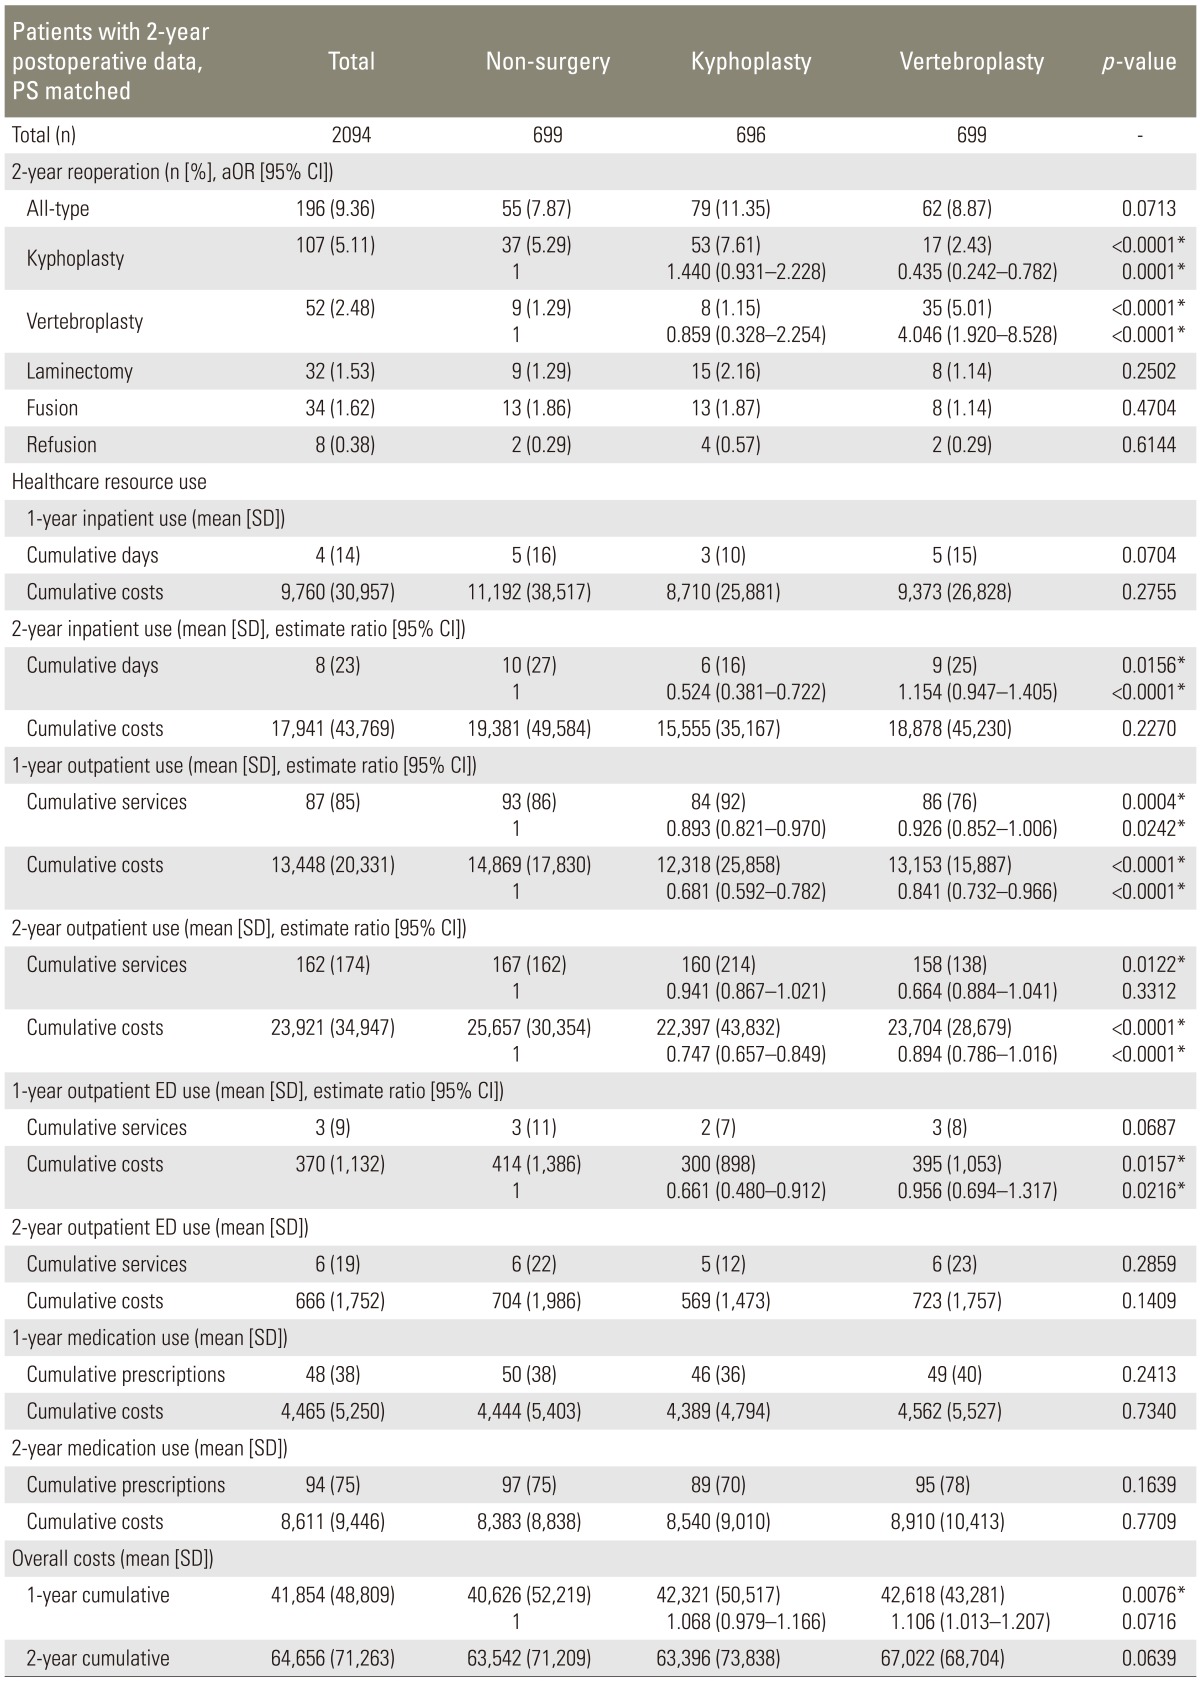
Table 1.
All patients with 2-year postoperative follow-up data, PS matched

p-values are for multivariate analysis adjusting for age, gender, Charlson index, postoperative time and the year of surgery.
PS, propensity score; SD, standard deviation; CI, confidence interval; ED, Emergency Department; aOR, adjusted odds ratio.
*p<0.05.
