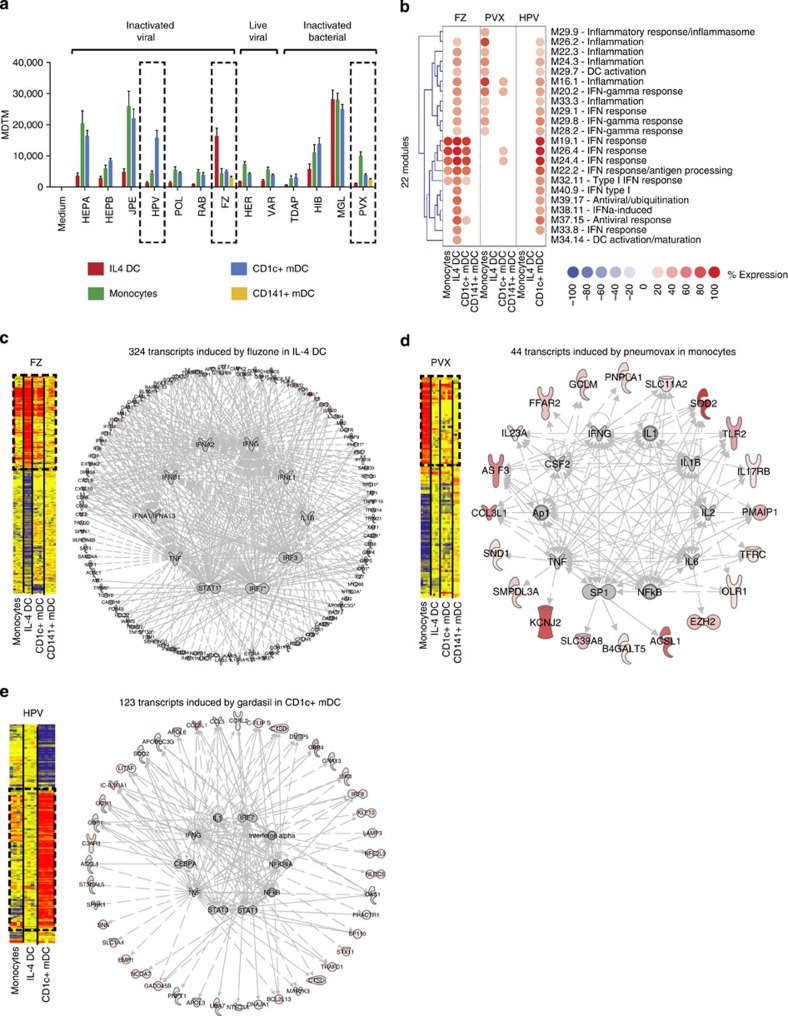
Figure 5. Population-specific transcriptional changes in response to PVX, FZ and HPV vaccines.
(a) Bar chart representing the MDTM derived from the 23,060 transcripts detected in monocytes, IL-4 DCs or blood mDCs stimulated with vaccines in vitro. Error bars represent the s.d. (b) Selection of the 22 modules overexpressed 40% in at least one of the four populations in response to PVX, FZ or HPV. (c) Network analysis of transcripts induced by Fluzone. Left panel: hierarchical clustering of transcripts differentially expressed by Fluzone. Right panel: IPA regulation networks of transcripts overexpressed by Fluzone in IL-4 DC. (d) Same as c for transcripts overexpressed by Pneumovax in monocytes. (e) Same as c for transcripts overexpressed by Gardasil in CD1c+ DCs.

