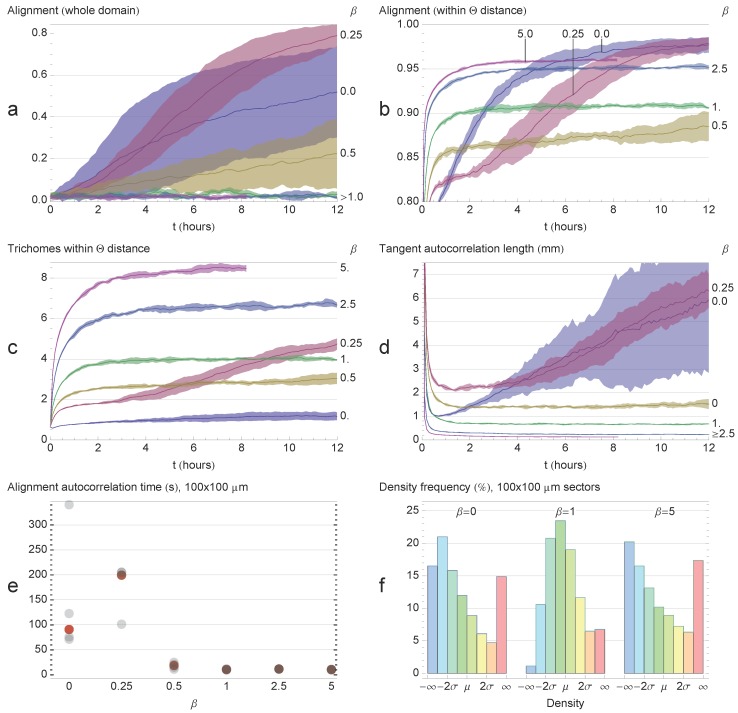
Figure 5.
Quantifying system observables. Shaded areas correspond to the standard deviation of the means of five simulations. All simulations ran for 12 h, except for β = 5, which ran for 8 h. (a) Global alignment. Global alignment decreases with β, with the exception of β = 0.25, which showed the highest degree of alignment; (b) Local alignment. Weak cohesion leads to a high degree of local alignment as the trichomes align in streams and become straighter. Medium values disorganize the system, and high values again lead to high local alignment as the trichomes aggregate into bands; (c) Local density increases with cohesion. β = 0.25 showing exceptional local density; (d) Tangent correlation length decreases with β. For low β, trichomes become straighter with time; (e) Alignment autocorrelation time in 100 × 100 μm sectors over two hours for each simulation. The red dot indicates the median value. Systems with little cohesion show much higher alignment correlation times than systems with significant cohesion; (f) Sector density distribution. The initial uniform distribution is Gaussian with mean μ and standard deviation σ. Self-organization for β ∈ {0,5}; is indicated by a skew in the density distribution as trichomes aggregate into patterns and depart from the uniform distribution. On the other hand, for β = 1, the system has a roughly normal distribution.

