Figure 3.

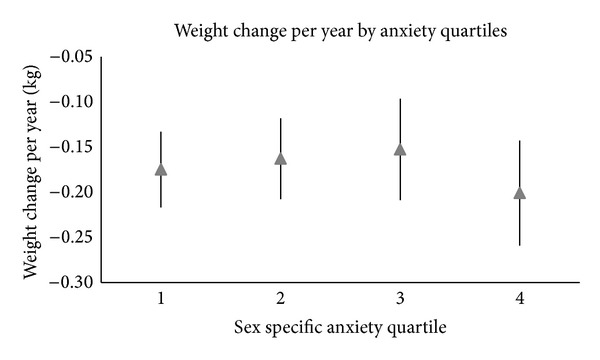
Graph of the mean and related confidence intervals of the change in weight per year (kg) by sex-specific anxiety quartiles.

Graph of the mean and related confidence intervals of the change in weight per year (kg) by sex-specific anxiety quartiles.