
Figure 3.
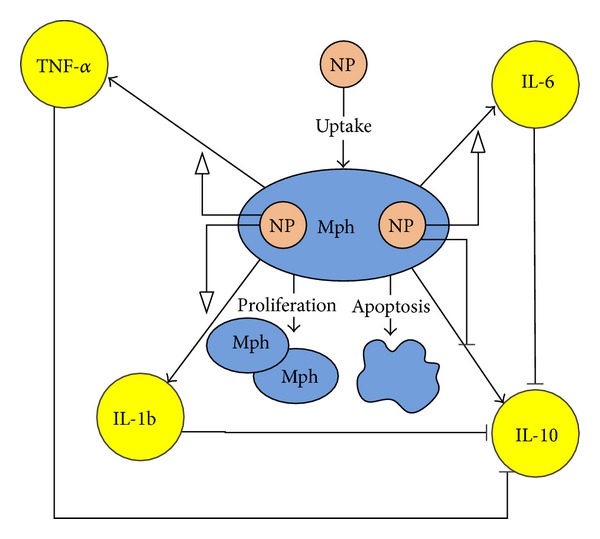
Schematic representation of macrophage dynamics involving proliferation, apoptosis, and cytokine secretion in vitro. (The diagram follows the standards of the Systems Biology Graphical Notation (SBGN); see http://www.sbgn.org).
Official websites use .gov
A
.gov website belongs to an official
government organization in the United States.
Secure .gov websites use HTTPS
A lock (
) or https:// means you've safely
connected to the .gov website. Share sensitive
information only on official, secure websites.
Schematic representation of macrophage dynamics involving proliferation, apoptosis, and cytokine secretion in vitro. (The diagram follows the standards of the Systems Biology Graphical Notation (SBGN); see http://www.sbgn.org).