
Figure 8.
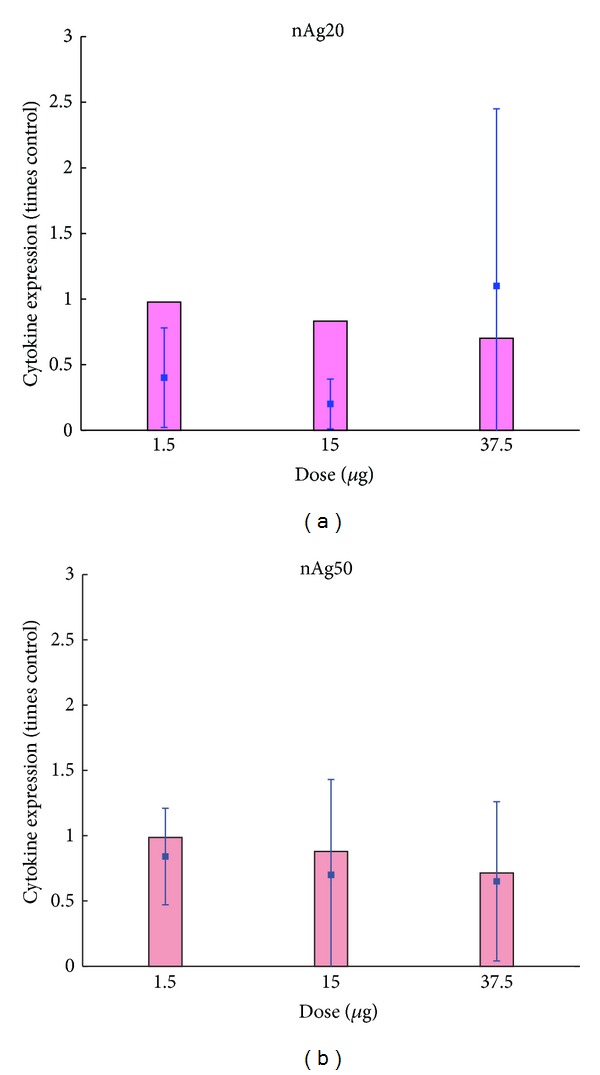
Comparison of model predictions and measured values of anti-inflammatory cytokine (IL-10) levels in culture medium after 4 hours for human MDMs with different doses of 20 nm (a) and 50 nm (b) nAg in vitro. Bars represent model predictions and squares and error bars represent in vitro measurements.