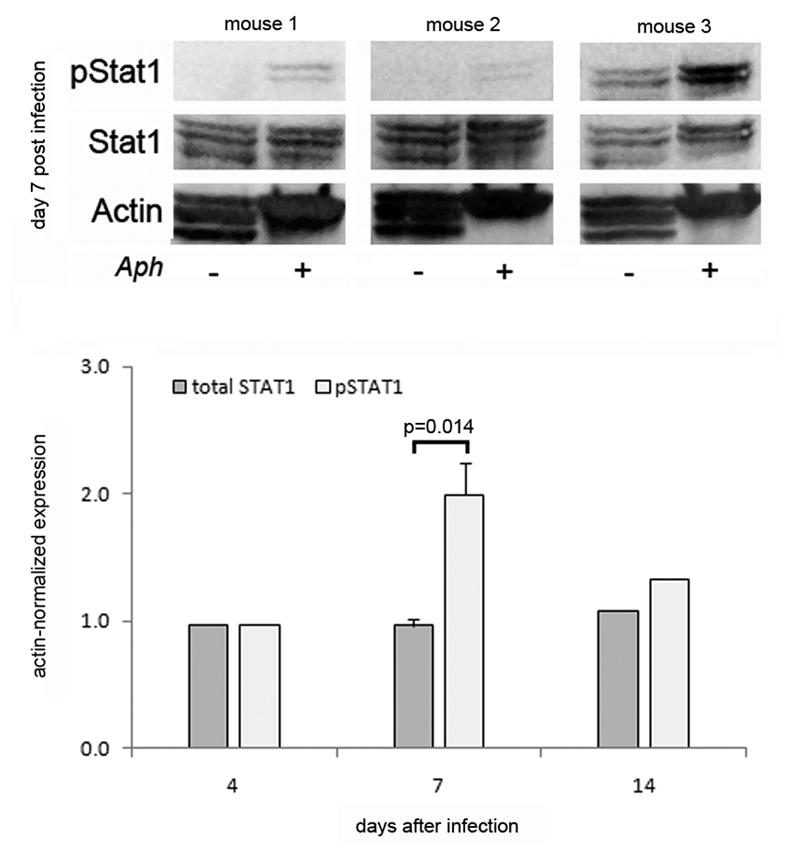
Figure 3.

Phosphorylation of Stat1 in splenocytesis increased in A. phagocytophilum-infected mice. C57BL6 mice were infected with cell free A. phagocytophilum and sacrificed at 4,7 and 14 days after infection. The expression of pStat1, total Stat1, and actin in pooled splenocytes from 4 animals and from 3 individual mice were analyzed by immunoblotting. The top panel shows the results of 3 individual mice (1 experiment representative of 4 total experiments); note the increase in pStat1 in each animal, despite the lack of increased total Stat1. The bottom panel shows the results of the normalized densitometric quantitative analysis. Error bars are shown only for day 7 that reflects the average expression in 4 pooled mice and 3 individual mice, whereas the results on days 4 and 14 reflect the expression only in the splenocytes pooled from 4 mice.
