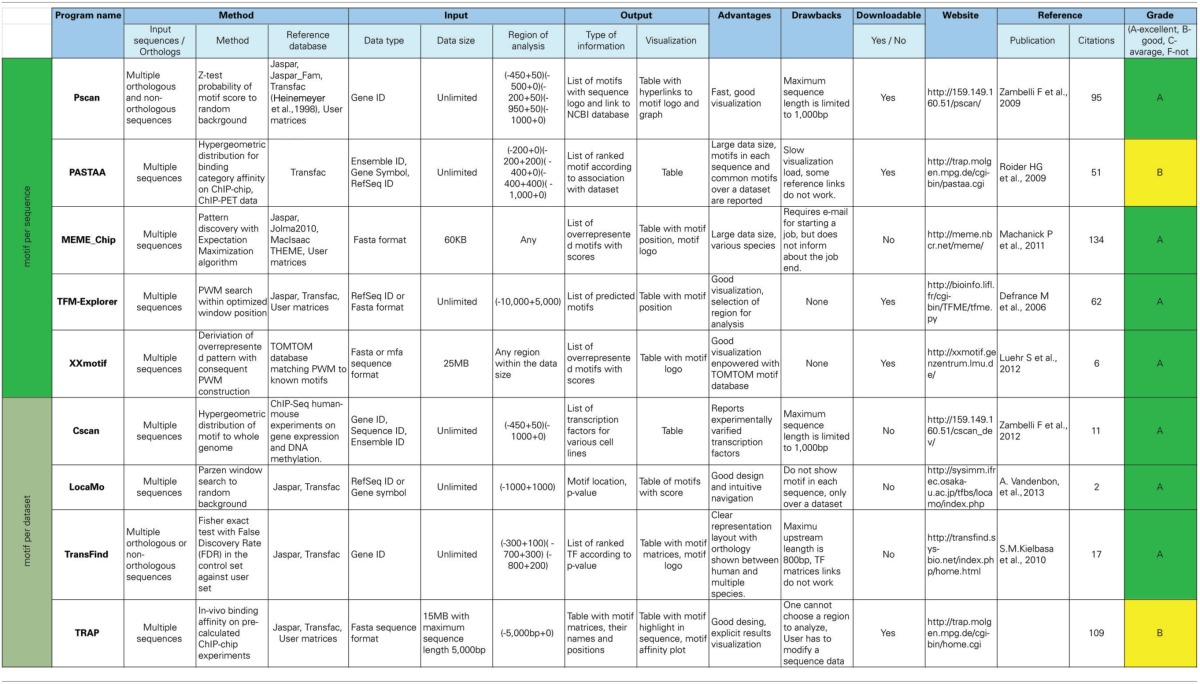
Table 1.
Programs used in this study.

The table includes following columns: “Method” column specifies the orthologous/non-orthologous approach, algorithm/statistics used, and the database used for motif annotation; “Input” describes size, format, and promoter region available for analysis; “Output” introduces results format and visualization capacity of the software. The next columns are “Advantages” and “Drawbacks” with useful/bulky features highlighted from the biologist's viewpoint. The next few columns post website information, publication citations, and availability of the software for downloading. The last column entitled “Grade” ranks programs according their suitability impact on our analysis. The leftmost column separates two types of programs: those that output found motifs per sequence; and those that output motifs over a dataset, classified as main and supportive in our analysis, respectively (see Methods). Grades are assigned as “A” (very good) and “B” (good).
