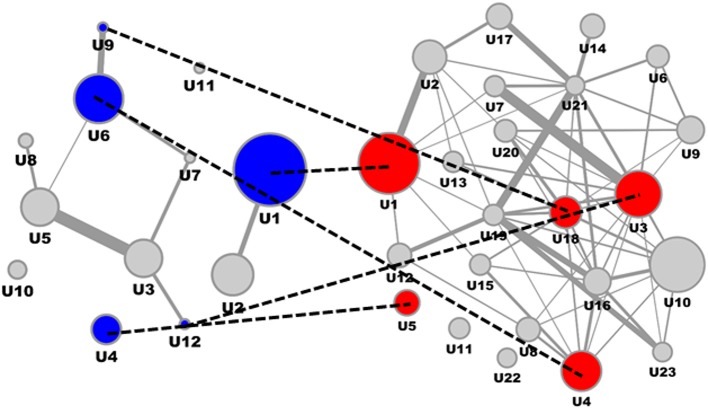
Figure 3.
ACE inhibitor mechanism of action molecular model and interference with DN molecular model. ACE Mechanism of Action molecular model (left) and DN molecular model (right), with overlapping process segments of drug and phenotype models indicated by dotted lines. Molecular process segments (U) of the ACE mechanism of action molecular model showing interference with the DN molecular model are given in blue, respective interacting process segments on the DN side are given in red.

