
Figure 2.
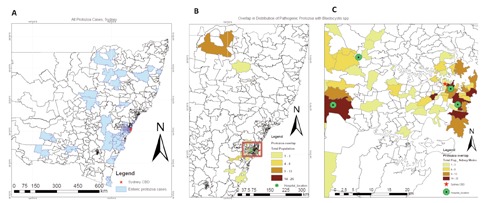
Distribution of cases of protozoa, and location of co-infections with Blastocystis spp and infectious protozoa, based on New South Wales Post Codes. The map illustrates (A) the total protozoa detected across the State from four hospitals; (B) where pathogenic protozoa cases overlap with cases of Blastocystis infection. Note change of scale in (C) showing a zooming in on dense cases in the Sydney City Business District.