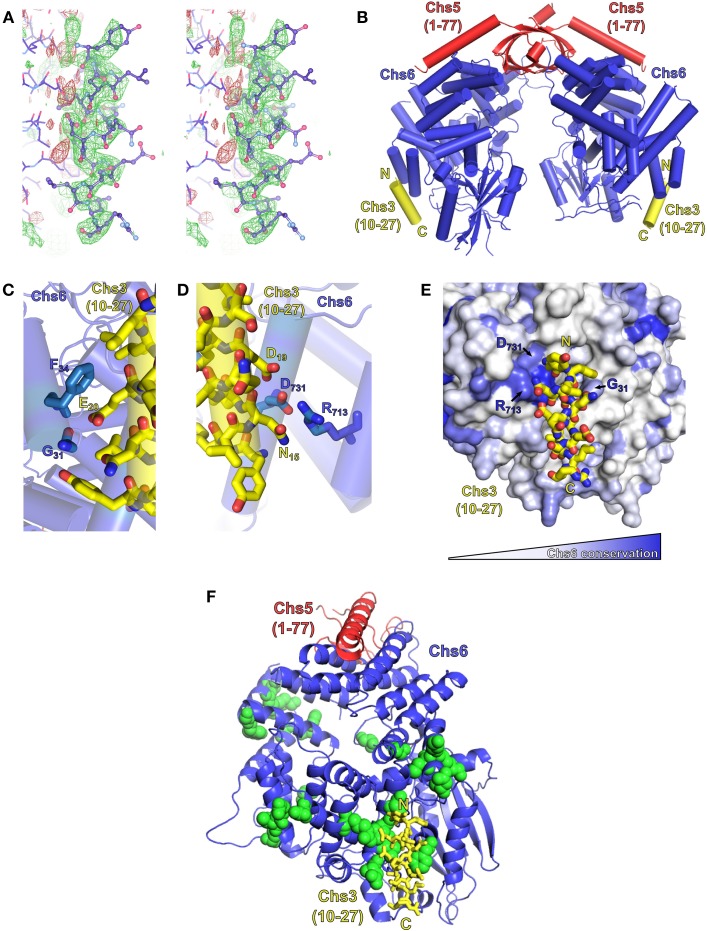
Figure 6.
Exomer co-crystalizes with Chs3 residues 10–27. (A) Stereo image (wall-eyed) of the original Fo-Fc difference map calculated after molecular replacement, used to model the Chs3 peptide (shown as ball-and-stick model), contoured at +2.5 σ (green) and −2.5 σ (red). The negative density to the left of the peptide is assumed to be due to series truncation errors arising from the modest resolution of the data. (B) Model of an exomer complex containing Chs5(1–77) (red), Chs6-6xHis (blue) and a peptide of Chs3 residues 10–27 (yellow, only residues 12–25 are visible). Model was created using Chs5(1–77)/Bch1 structure (PDB ID: 4IN3) (Richardson and Fromme, 2013) as a template, replacing each Bch1 subunit with the structure of Chs6 and peptide from this study. (C,D) Close-up views of the interaction of the Chs3 peptide with Chs6. (E) Chs6 colored by conservation within Chs6 and Bch2 ChAP proteins, white to blue representing low to high conservation. (F) Structure rotated 90° from (A), showing location of Chs6 mutations that had no effect on Chs3 trafficking (green spheres), as listed in Table 2. This panel also depicts the crystallographic asymmetric unit.

