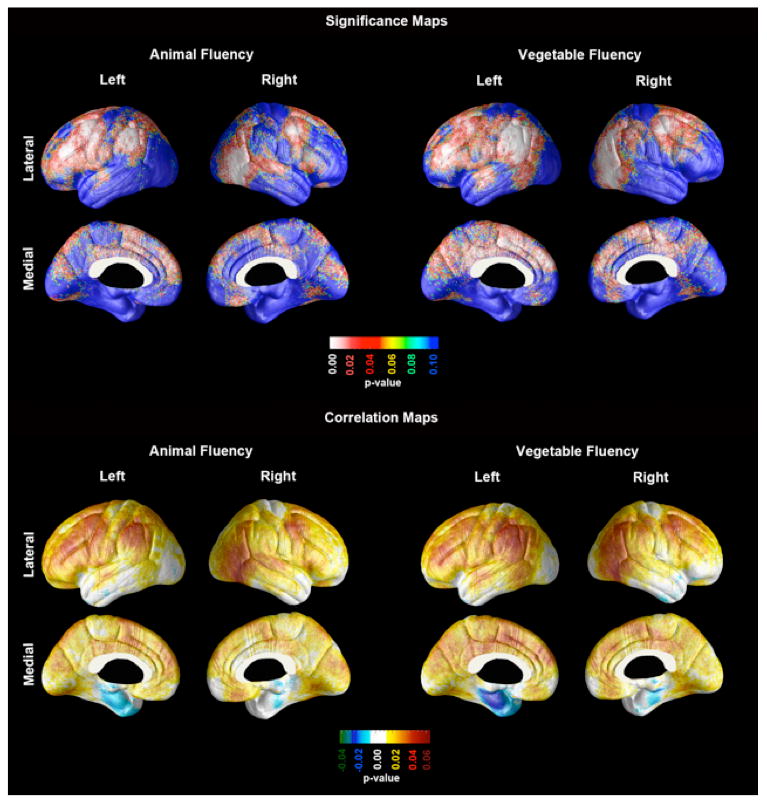
Figure 1.

Statistical (top) and Correlation (bottom) maps demonstrating the associations between the Category Fluency Animals and Category Fluency Vegetables test scores to cortical thickness in a pooled sample of subjects diagnosed as Normal Controls, Mild Cognitive Impairment, or Probable Alzheimer's disease.
