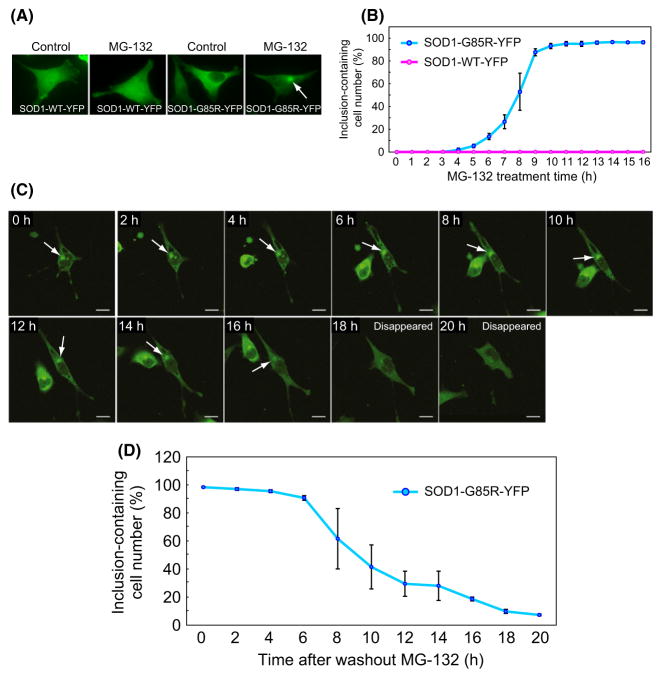
Figure 1.
Disaggregation of mutant SOD1 from inclusions to the cytosol. (A) HeLa cell lines stably expressing SOD1-WT-YFP or SOD1-G85R-YFP were treated with MG-132 or DMSO (used as a negative control). The white arrow indicates a perinuclear inclusion. (B) Numbers of cells containing SOD1-YFP inclusions during 16-h treatment with MG-132 (mean ± SD, n > 600). (C) Disappearance of inclusions during recovery of proteasome activity. After 16-h treatment with MG-132, cells were transferred to a recovery culture without MG-132 and incubated for the indicated periods. Time-lapse images were taken using a confocal microscope. White arrows indicate inclusions. (D) Numbers of cells containing inclusions during the recovery culture (mean ± S.D., n > 600).

