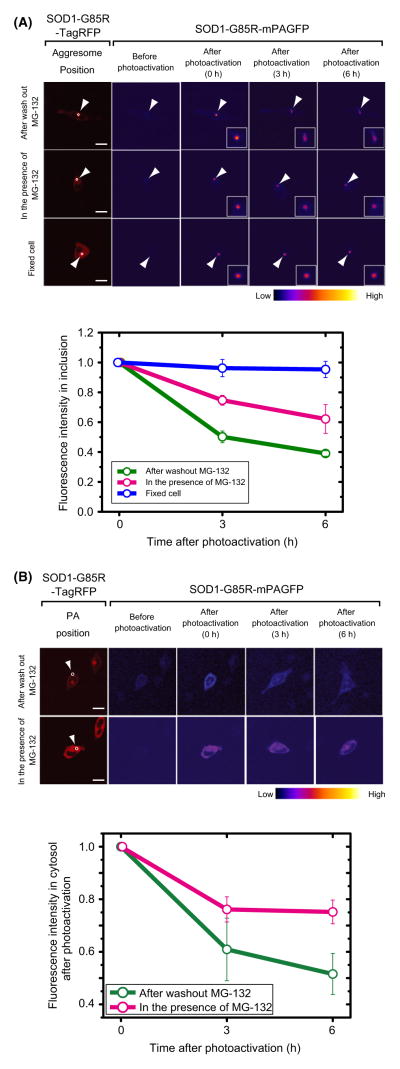
Figure 2.
Photoactivation analysis of SOD1-G85R-mPAGFP during disappearance of inclusions, in inclusions (A) and in the cytosol (B). Red images in the far left column show the distribution of cotransfected SOD1-G85R-TagRFP. Pseudo-colored images indicate the intensity of photoactivated green fluorescence from SOD1-G85R-mPAGFP. White circles show photoactivated regions. White arrowheads indicate inclusions. Bar = 10 mm. Graphs show quantified fluorescence intensities after photoactivation. The relative cytosolic fluorescence intensity during chase periods (3 and 6 h) was normalized against the intensity immediately after photoactivation (0 h; n = 3–4).

