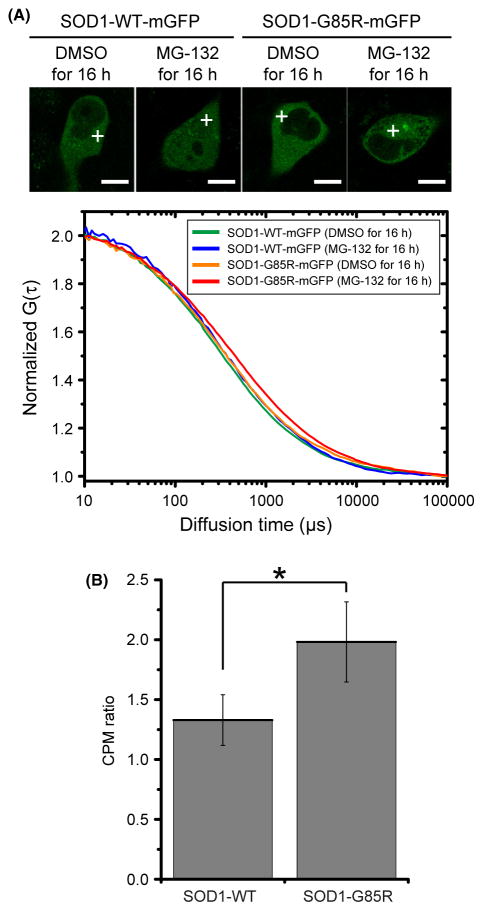
Figure 4.
FCS analysis using live cells expressing SOD1-mGFPs. (A) FCS measurements were taken in the cytosolic positions indicated by white crosses. Cells were analyzed under the indicated conditions (top), and the quantified data are presented as averages of the normalized autocorrelation function (n = 3–4) (bottom). (B) CPM ratio in live cells expressing SOD1-mGFPs. Significant differences were determined using Student’s t-test: ★P < 0.01.

