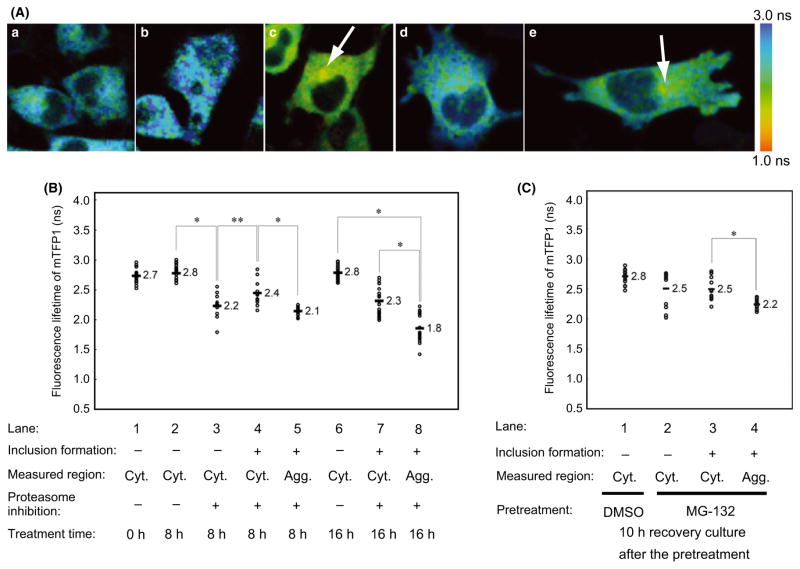
Figure 5.
FRET-FLIM analysis of mutant SOD1 in inclusions and cytosol during aggregation and disaggregation. (A) Pseudo-color fluorescence lifetime images of cells expressing both SOD1-G85R-mTFP1 and SOD1-G85R-cp173mVenus. White arrows indicate inclusions. Cells were treated for 16 h with no reagents (a), DMSO (b), or MG-132 (c). After MG-132 treatment for 16 h, cells were transferred to the recovery culture and incubated for 10 h (d and e). Images of cells without (d) or with (e) inclusion structures are shown. (B, C) Comparison of the fluorescence lifetime of the FRET donor SOD1-G85R-mTFP1 after MG-132 treatment for 8 h (B, lanes 2–5) or 16 h (B, lanes 6–8), or in recovery culture for 10 h (C, lanes 1–4). Fluorescence lifetime values of individual cells are shown as open circles (n = 10–20), and average values are shown with bars. Significant differences were determined using Student’s t-test: ★P < 0.01, ★★P < 0.05.

