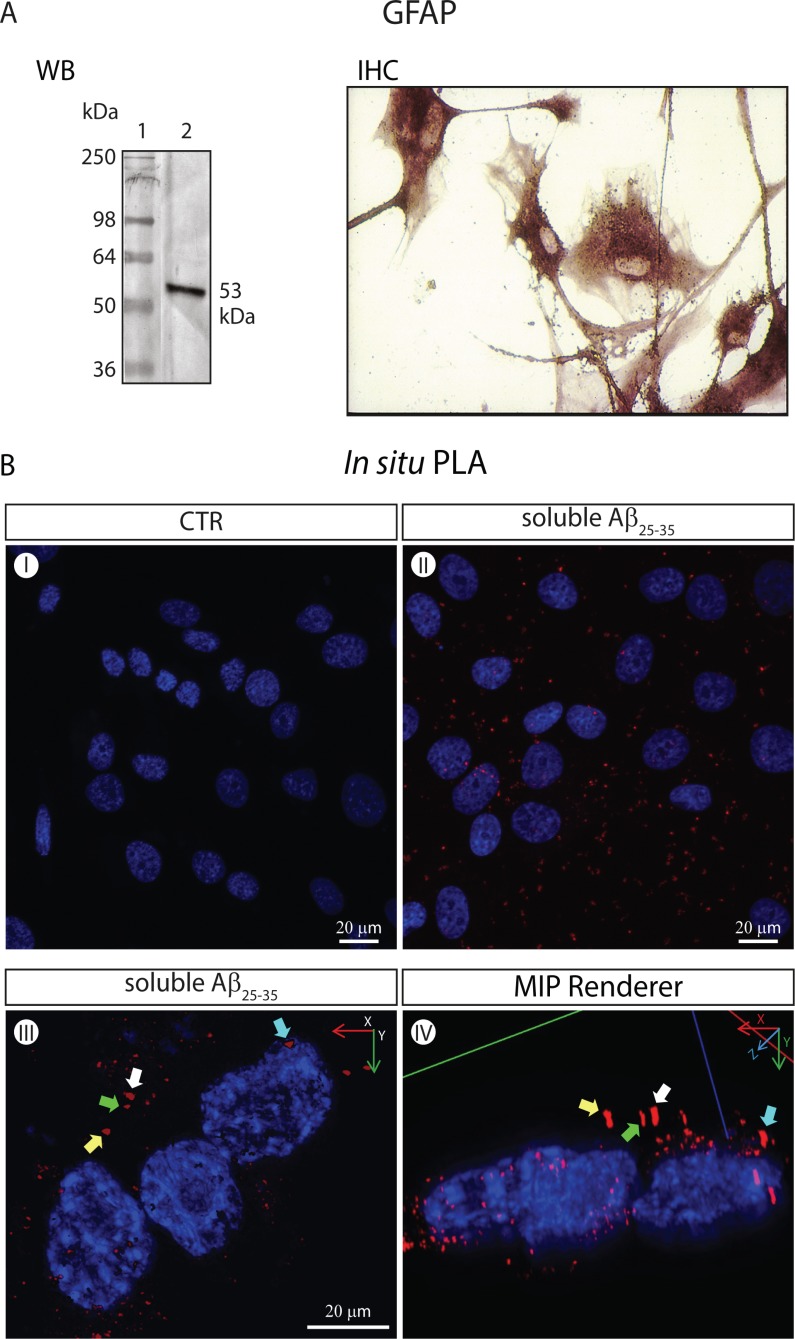
Fig. (3).
The CaSRs of GFAP-expressing NAHAs form specific complexes with soluble Aβ25-35 moieties visualized via the in situ PLA (isPLA) method. (A). Untransformed proliferatively quiescent NAHAs set in culture strongly express the GFAP marker. WB. GFAP Western immunoblotting was carried out according to Chiarini et al. [108] on NAHAs protein lysates using an anti-human GFAP rabbit polyclonal antiserum followed by an alkaline phosphatase (AP)-conjugated secondary antibody. Lane 1, molecular weight markers. Lane 2, specific GFAP protein band (53 kDa). IHC. GFAP immunohistochemistry on NAHAS using an anti-human GFAP mouse IgG1 followed by an AP-conjugated secondary antibody (for technical details see [108]). (B) Imaging of specific Aβ25-35●CaSR complexes via the in situ Proximity Ligation Assay (isPLA) according to Söderberg et al. [105] and 3D digital renderings. Proliferatively quiescent NAHAs were exposed for 1 h at 37 °C to soluble biotinylated Aβ25-35 (5.0 mM, Anaspec, CA, USA) dissolved in complete growth medium prior to fixation in 4 %v/v paraformaldehyde (PFA). Notably, after fixation NAHAs were not permeabilized, which restricted the antigen-antibody interactions to the outside of their plasma membrane. A mouse anti-CaSR monoclonal and a rabbit anti-biotin polyclonal were the two primary antibodies. The PLUS and MINUS isPLA probes were donkey anti-rabbit IgG (heavy + light chains) and donkey anti-mouse IgG (heavy + light chains), respectively (Olink Bioscience, Uppsala, Sweden). Once challenged with antibodies and isPLA probes, the samples were sequentially incubated with the Duolink Hybridization Solution, Ligation Mix, and Amplification Mix (all from Olink Bioscience) to produce single-stranded rolling-circle amplification products that were hybridized to oligonucleotide probes labeled with the red fluorophore Tye624 (λex = 594 nm and λem = 624 nm) by incubating with the Duolink Detection Reagents (Olink Bioscience). Next, nuclear DNA was stained with 1.0 µg ml−1 4′,6-diamidino-2-phenylindole dihydrochloride (DAPI, Sigma-Aldrich). Pictures were acquired under a Leica TCS SP5 AOBS Laser confocal microscope (Leica-Microsystems, Wezlar, Germany). A 40X/1.25 NA oil-immersion objective (HCX PL APO 40x 1.25 OIL UV, Leica-Microsystem) was used. The Maximum Intensity Projection (MIP) renderingsof original isPLA pictures were obtained using the Image Pro Plus 3D Viewer (Image-Pro Plus TM, version 7.0, Media Cybernetics, Bethesda, MD). (I) Untreated (i.e. not exposed to Aβ25-35) NAHAS show no specific isPLA signal or background. Only the DAPI-stained nuclei are detectable. (II) Aβ25-35-incubated NAHAs exhibit isPLA signals (red dots) corresponding to specific Aβ25-35●CaSR complexes that are in part aggregating in patches. Nuclear DNA is blue (DAPI). (III) A higher magnification of Aβ25-35-exposed adult human cortical astrocytes showing specific Aβ25-35●CaSR complexes (in red) visualized via the isPLA method. Nuclear DNA is blue (DAPI). The complexes have started aggregating in patches, an event preceding their internalization. Some of the patches have been purposedly marked by differently colored arrows to allow the identification of the same patches in a different projection shown in panel (IV). (IV) The 3D MIP-rendering of the picture shown in panel (III) seen in an oblique lateral projection. The colored arrows indicate the same specific Aβ25-35●CaSR complexes (in red) as in panel (III). The location of the Aβ25-35●CaSR complexes at the periphery of the cytoplasm can be appreciated here somewhat better than in the top-bottom 2D image in panel (III).

