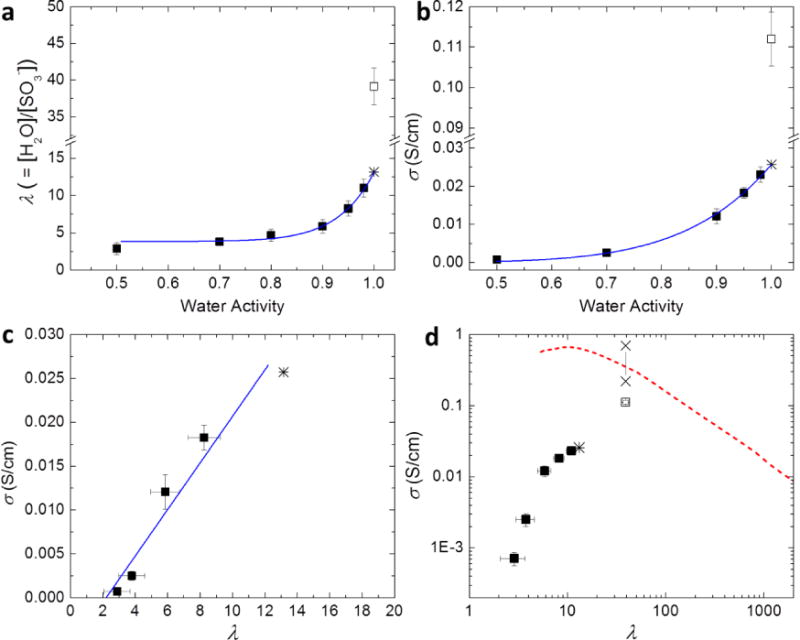
Figure 1.

Water uptake and proton transport properties of hydrated S-SES. (a) Hydration number, λ, and (b) proton conductivity, σ, as a function of water activity, aw. (c) Proton conductivity, σ, as a function of λ, on a linear scale. The solid line represents a linear fit. (d) Proton conductivity, σ, as a function of λ, on a log-log plot. Solid squares represent measurements conducted in a humidity-controlled environmental chamber. Open squares represent measurements performed in liquid water. Solid curves in (a) and (b) are power law fits of data points with aw ≤ 0.98. The extrapolation of the power law to aw = 1 yields λfit and σfit, shown by stars in (a), (b), and (c). Two × data points in (d) represent the intrinsic conductivity range of the hydrated microphase of the S-SES copolymer equilibrated in liquid water. Also shown in (d) is σ as a function of λ of aqueous HCl solutions, dashed curve, data taken from ref 36.
