Figure 3.

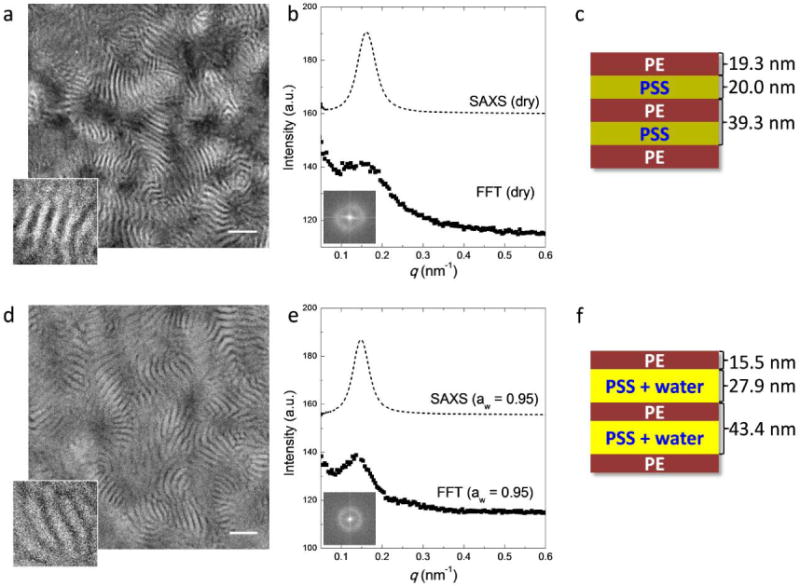
(a) and (d) Scanning transmission electron microscopy (STEM) of S-SES in the dry state (a) and equilibrated at aw ≈ 0.95 (d). For clarity, a small portion of the images was magnified and shown on the bottom left corner of each image. Scale bar represents 200 nm. The corresponding 2D and radially-integrated FFT patterns are shown in (b) and (e) as insets and solid squares, respectively. Dashed lines in (b) and (e) depict the SAXS profiles of S-SES bulk membranes in the dry state and equilibrated at aw = 0.95. (c) and (f) Schematics showing the morphologies of S-SES in the dry state and equilibrated at aw ≈ 0.95.
