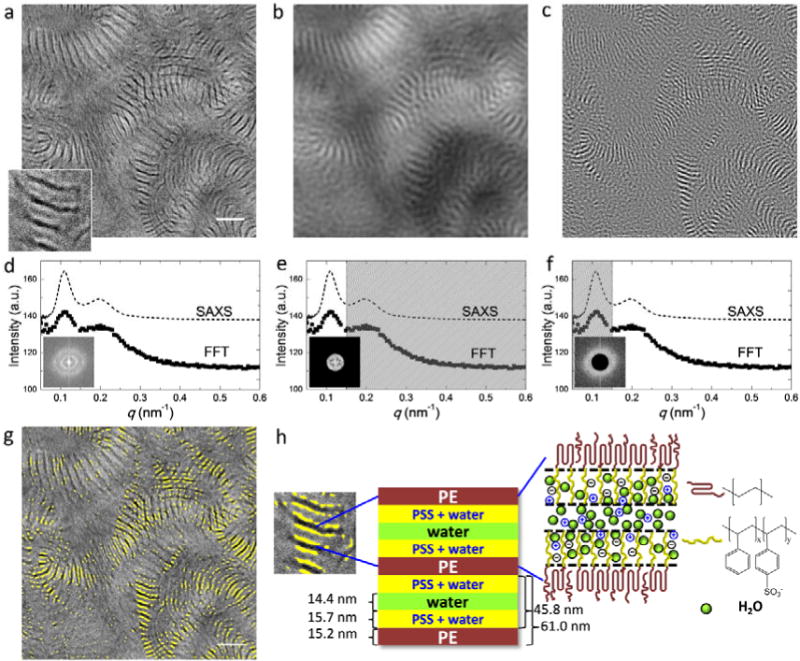
Figure 4.

(a) Cryogenic STEM of S-SES equilibrated in liquid water. For clarity, a small portion of the image was magnified and shown on the bottom left corner. Scale bar represents 200 nm. The corresponding 2D and radially-integrated FFT patterns are shown in (d) as inset and solid squares. SAXS profile of S-SES bulk membrane equilibrated in liquid water is depicted by the dashed line in (d). Low pass and high pass frequency filters with a cutoff frequency of 0.15 nm−1 were applied to the STEM image in (a) and the resulting images are shown in (b) and (c), respectively. The actual frequency filters are shown in (e) and (f). Frequency filtering enables the identification of the structures responsible for the primary and secondary FFT and SAXS peaks. Figure (g) is the superposition of (a) and (c). The bright regions in (c) are highlighted in yello0w in (g). A schematic of the morphology of S-SES equilibrated in liquid water is shown in (h). In particular, a heterogeneous channel comprising hydrated PSS-rich brushes sandwiching a water-rich layer is depicted.
