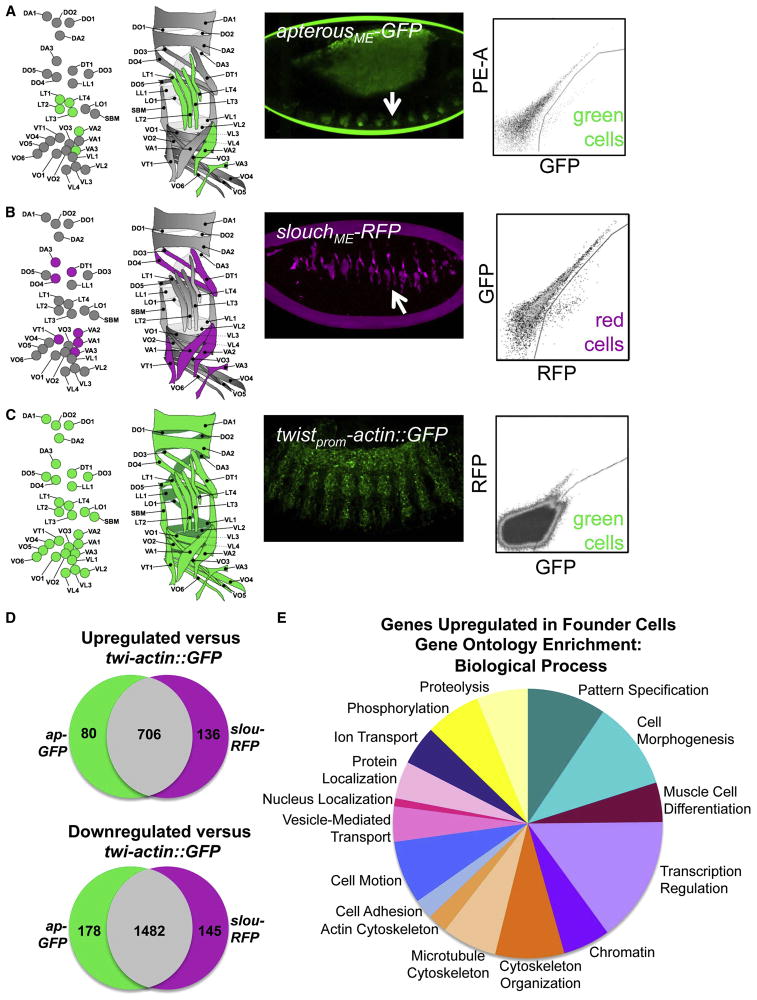
Figure 1. FACS and Transcriptional Profiling of Drosophila Muscle Founder Cells.
(A–C) Fluorescent transgenes marked subsets of muscle cells for FACS. Diagram of FCs labeled by each transgene at stage 13 (left) and into which muscles those FCs develop at stage 16 (right). Confocal projections show transgene expression at stage 13 and representative sort plots show positive cells. “PE-A” designates the fluorophorephycoeryhtrin. (D) Overlap between the gene lists derived from the microarray results. (E) GO Biological Process categories found to be enriched in FCs. See also Tables S1–S3.

