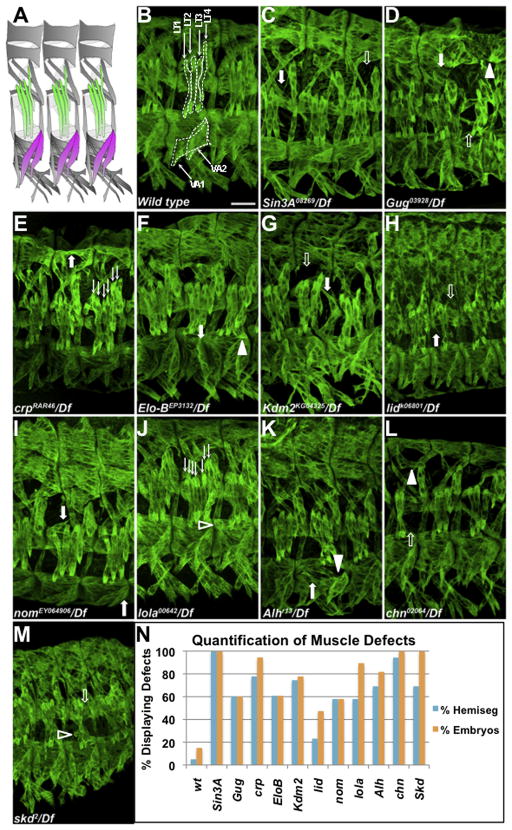
Figure 2. Mutants for Genes Identified by Microarray Display Muscle Phenotypes.
(A) Diagram of wild-type muscle pattern of three hemisegments at stage 16. The LT muscles are green and the VA muscles are magenta (B–M) Stage 16 embryos stained with anti-Myosin heavy chain (MHC). In this and all following figures, unless indicated, approximately 3 hemisegments are shown, Scale bar, 25 μm. In the wild-type embryo, the LT and VA muscles of one hemisegment are outlined with dashed lines. Mutant phenotypes are indicated by filled arrows (misshapen), open arrows (missing muscles), line arrows (extra muscles), filled arrowheads (misattached muscles) and open arrowheads (unattached myospheres). (N) Percentage of hemisegments (blue) and embryos (orange) displaying aberrant phenotypes in each mutant background. Five abdominal hemisegments from at least 20 embryos for each genotype were quantified. See also Figures S2–S4.

