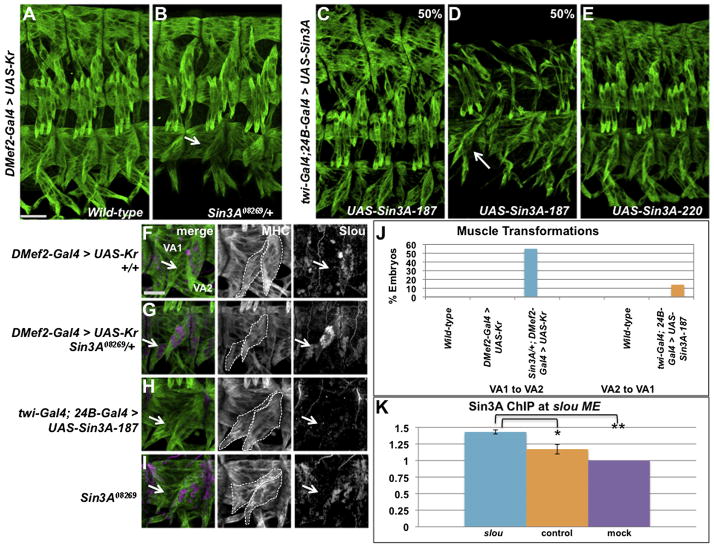
Figure 5. Alteration of Muscle Identity in Sin3A Gain and Loss of Expression Embryos.
(A–B) Stage 16 embryos stained with anti-MHC. Arrow points to the VA1 to VA2 muscle transformation in Sin3A08269/+; DMef2-Gal4 > UAS-Kr embryos. 55% of embryos in (B) display the muscle transformation, n=20. Scale bar, 25 μm.(C–E) Stage 16 embryos stained with anti-MHC expressing either the 187 or 220 kDa isoforms of UAS-Sin3A under the control of twi-Gal4; 24B-Gal4. Arrow points to VA2 to VA1 muscle transformation, 14% of embryos, n=56. (F–I) Slou expression (white in single channel, magenta in merge) in the VA muscles of stage 16 Sin3A08269 mutant embryos, Scale bar, 15μm. Embryos are also stained with anti-MHC (green) to show muscle pattern, and VA1 and VA2 are outlined with dashed lines. One hemisegment is shown. Arrows point to muscle VA2. (J) Quantification of ventral muscle transformations in Sin3A gain and loss of function embryos. Five abdominal hemisegments from at least 20 embryos for each genotype were quantified. (K) ChIP was performed on extracts from wild-type embryos at stage 13 using anti-Sin3A antibody. The presence of the slou mesodermal enhancer or a control region was assayed in precipitated samples by quantitative PCR. Sin3A binding was significantly enriched at the slou mesodermal enhancer (blue) compared to the control region (orange, p=0.045), as well as relative to mock (purple, p=0.003). Error bars indicate standard deviation. See also Figure S6.

