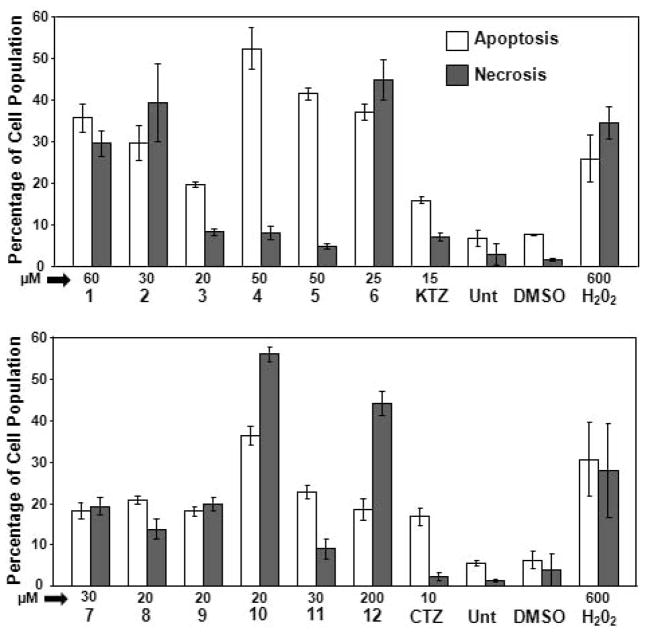
Figure 3.
Evaluation of cell death via flow cytometry. YT cells were exposed to the various Ru-based compounds for 18 hrs and stained with annexin V-FITC and PI. Cells treated with Ru-KTZ (A) or Ru-CTZ (B) complexes were compared to cells treated with uncomplexed KTZ and CTZ. Cells treated with the solvent control (0.3% v/v DMSO) and cells exposed to 600 μM Hydrogen peroxide (H2O2), were included as negative and positive cytotoxicity controls, respectively. Untreated (Unt) cells were also included to determine the viability of cells during the course of the experiments. Cells identified as annexin V-FITC positive were considered as apoptotic and the percentage of these cells is expressed as the sum of percentages of both early and late stages of apoptosis (white bars). Cells that were only stained with PI (but not with annexin V-FITC) due to the loss of plasma membrane integrity are considered necrotic cells (grey bars). The concentration (in μM), as well as the name of each experimental compound is shown below of the x-axis. Each bar represents the mean of three independent measurements with their respective standard deviations.

