
Figure 4.
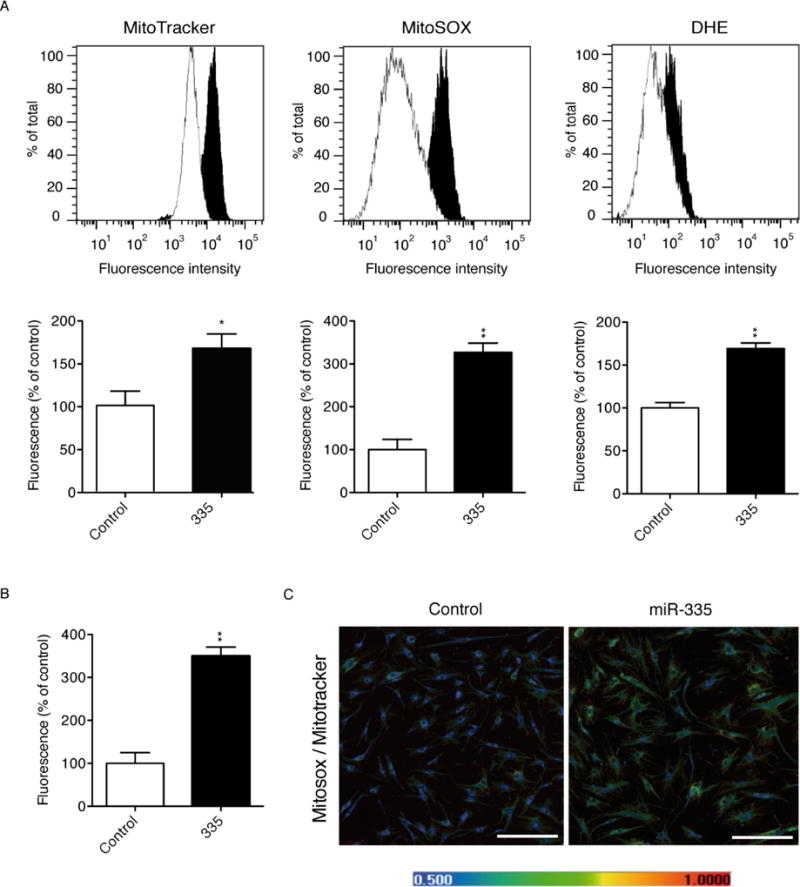
Forced miR-335 expression increases mitochondrial mass and ROS levels in hMSCs. (A): Upper panels, flow cytometry histograms of mitochondrial mass measured using MitoTracker®, and total and mitochondrial reactive oxygen species measured by DHE (di-hydroethidium) and MitoSOX™, respectively, in 335-(black histograms) and control-(white histograms) in hMSCs. Lower panels, relative fluorescence levels in 335-hMSCs shown as the percentage of control-hMSCs. (B): Relative fluorescence levels of mitochondrial reactive oxygen species measured with MitoSOX were normalized with fluorescence levels of mitochondrial mass using MitoTracker. Results in 335-hMSCs are shown as the percentage of control-hMSCs. (C): Representative confocal microscopy images of control- and 335 hMSCs after staining with MitoTracker, MitoSOX and DAPI. Color scale shows false color referring to increasing fluorescence MitoSOX:MitoTracker values, from lowest (blue) to highest (red), scale bar represents 500μm. *p<0.05; **p<0.005. Error bars represent s.e.m. (N=3).