
Figure 7.
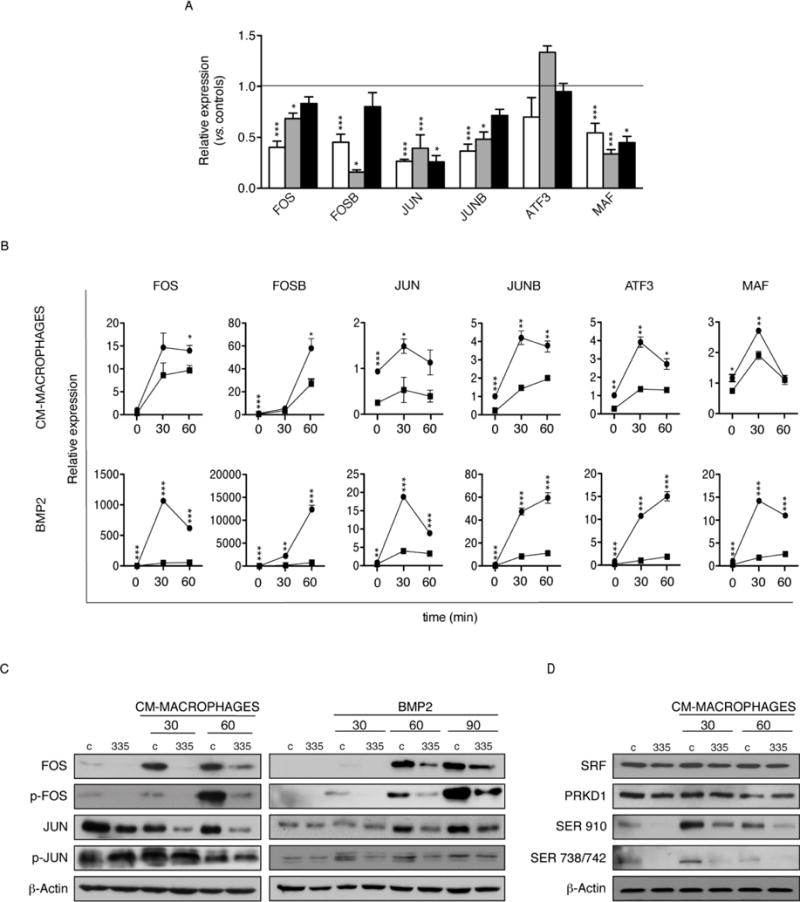
AP-1 activation in response to migration and differentiation stimuli is modulated by miR-335. (A): Relative basal expression levels of AP-1 components (MAF, ATF3, JUN, JUNB, FOS, FOSB; GAPDH as endogenous control) measured by real-time RT-PCR in 335-hMSCs from three different donors, versus the corresponding control-hMSCs. mRNA expression levels are presented as the relative fold-increase compared with control-hMSCs (horizontal line). The different colored bars correspond to three independent hMSC isolates. (B): Relative expression levels of AP-1 components in control- (black circles) and 335-hMSCs (black squares) after treatment with Mϕ-CM or BMP2 at indicated time points, measured by real-time RT-PCR. (C): Western blot analysis of AP-1 components after Mϕ-CM (left panel) and BMP2 (right panel) treatments at indicated times. Representative results from at least three experiments are shown. (D): Western blot analysis of SRF, PRKD1, and phospho-specific PRKD1 SER910 and SER738/742 protein levels after Mϕ-CM treatment at indicated times. Representative results from at least three experiments are shown. *p<0.05; **p<0.005; ***p<0.005. Error bars represent s.e.m. (N=3).