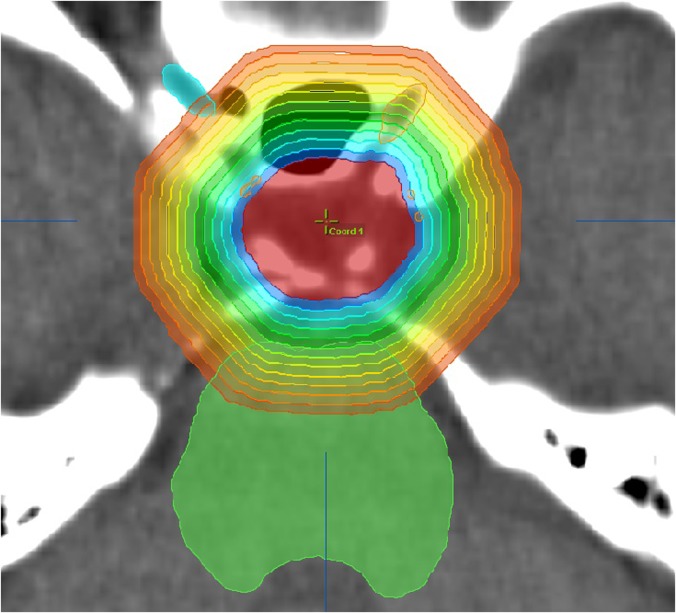
Figure 1.
The zoomed in axial view of one example patient (Patient 4) showing multiple concentric 1-mm-thick rind structures generated from the planning target volume surface. Although only a few rind structures are shown in the figure to avoid crowdedness, rind structures were generated layer by layer until they reached the closest head surface for each plan. The average dose in each rind was calculated to study the normal tissue dose.

