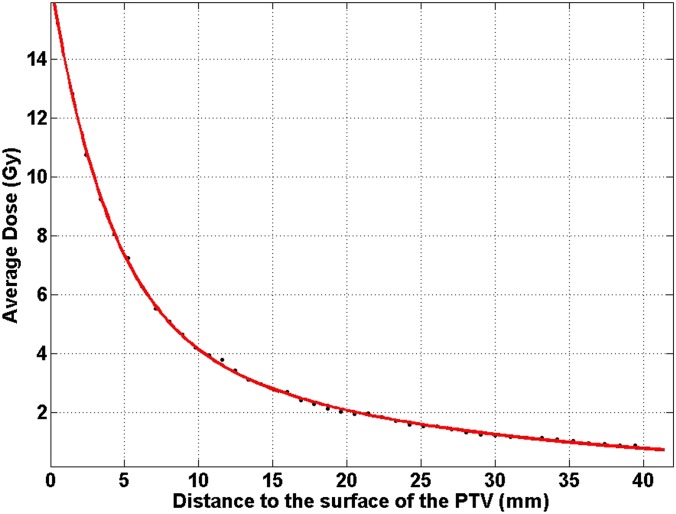
Figure 2.
One example patient plan (Patient 4 at 80% prescription isodose level) showing the average dose in each rind structure as a function of the distance from the surface of the planning target volume (PTV). The fitted values of Equation (1) were a1 = 18.43 (Gy), a2 = 4.218 (Gy), b1 = 0.2477 (mm−1) and b2 = 0.04334 (mm−1).

