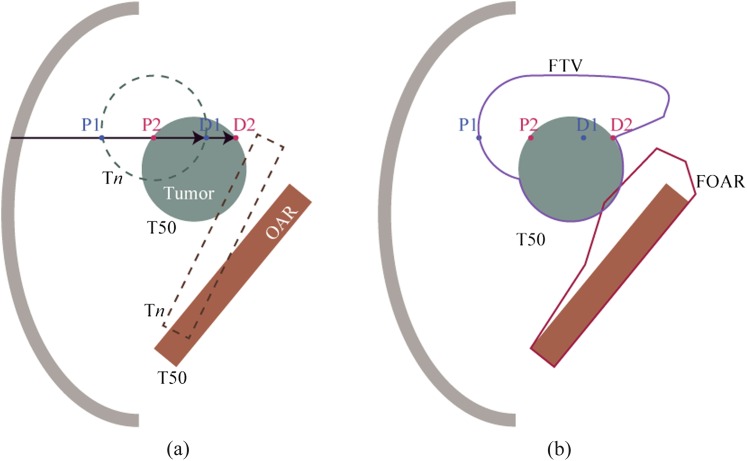
Figure 3.
(a) Target and organs-at-risk positions at the reference phase (T50) and Tn. D1 and P1 are distal and target proximal position at Tn, respectively. D2 and P2 are distal and target proximal position at T50, respectively. (b) Field-specific target volume (FTV) and field-specific organs at risk (FOAR) were projected on the CT image at the reference phase (T50). OAR, organ at risk.

